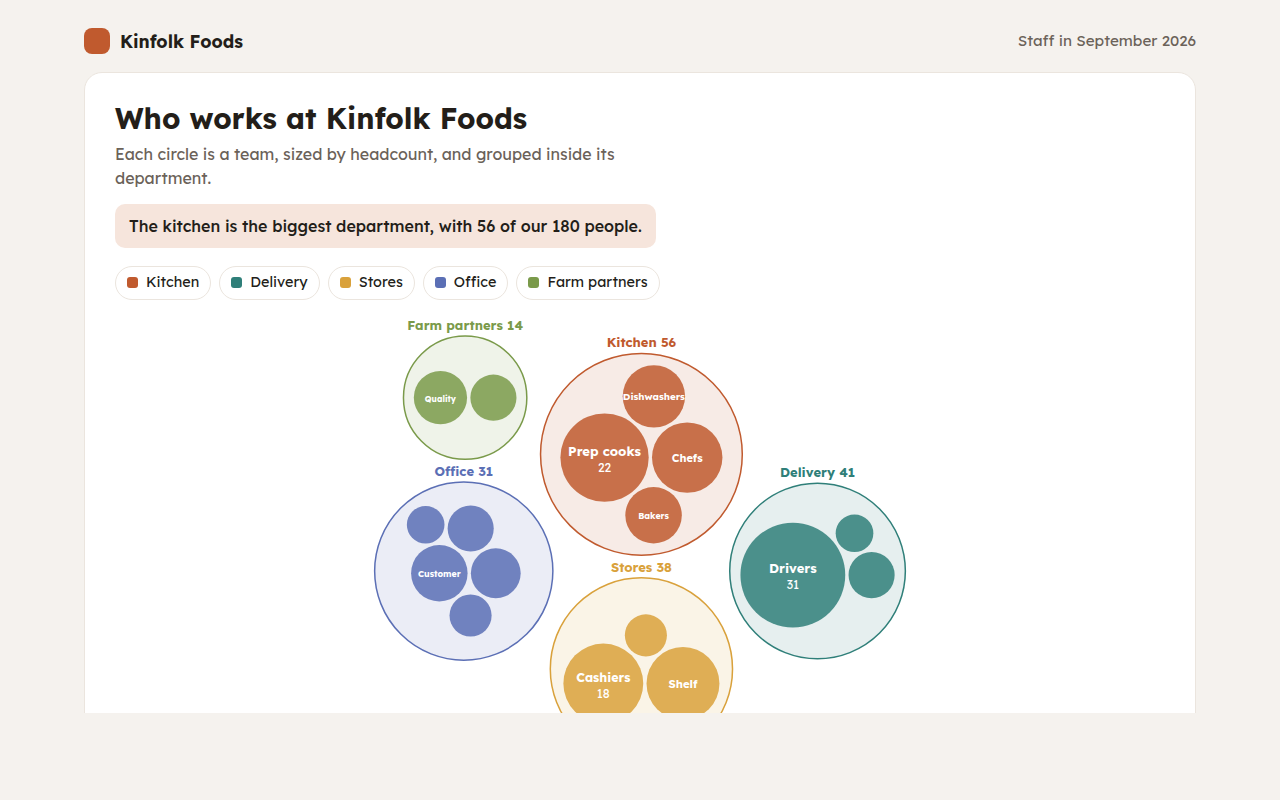
Home / Part to Whole
Part to Whole in HTML and JavaScript
These charts show how a whole splits into parts: how people paid, where money goes, what fills a drive. Use a pie or donut for a few simple shares, a waffle when you want people to picture the numbers, and a treemap, sunburst or icicle for nested data. Each chart is one HTML file with no library.
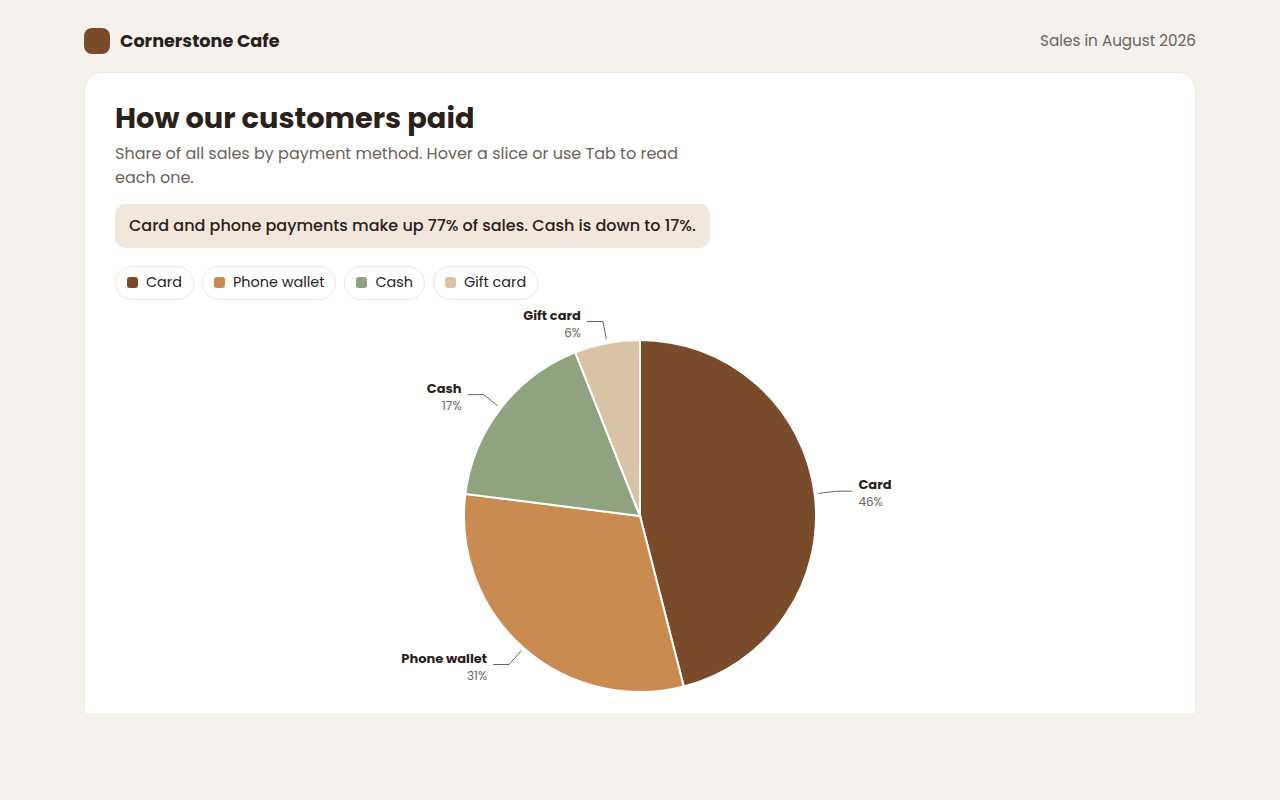
021. Pie Chart
Example: how customers paid at a cafe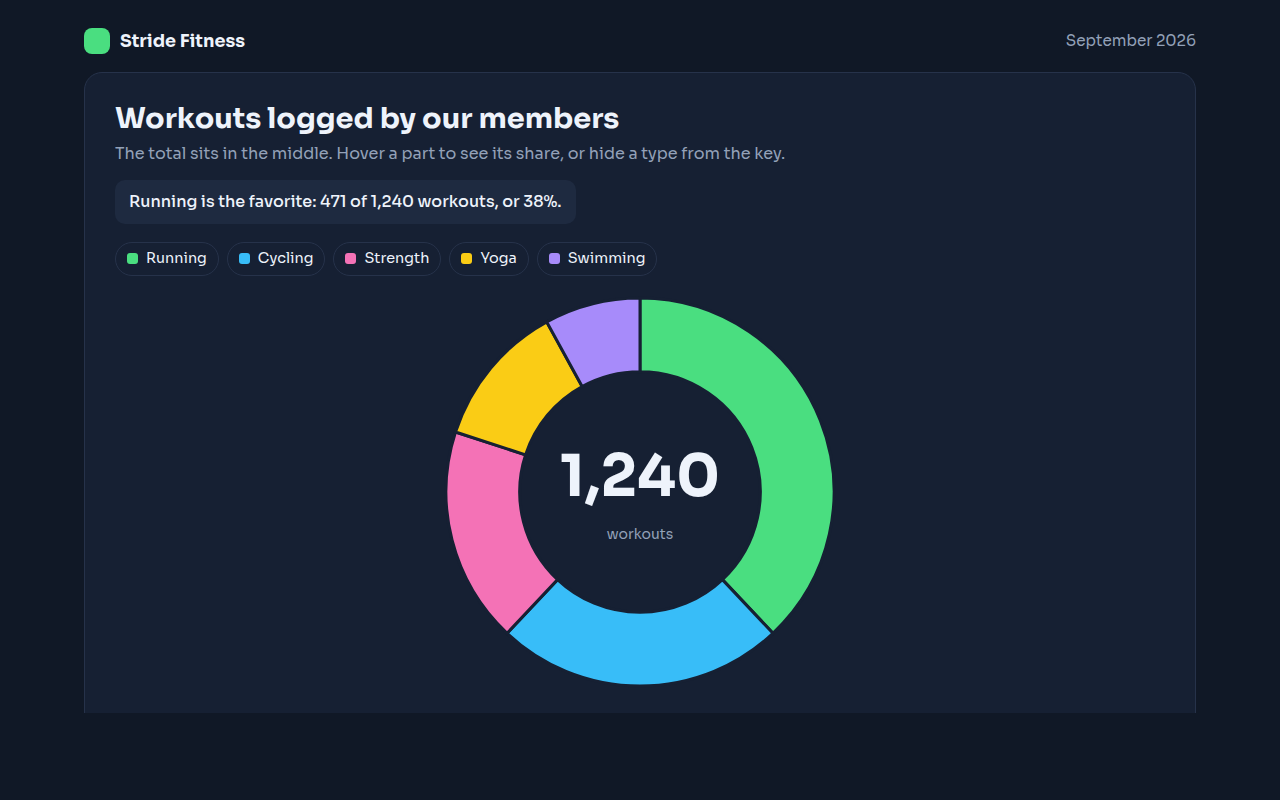
022. Donut Chart
Example: workouts logged by members of a fitness app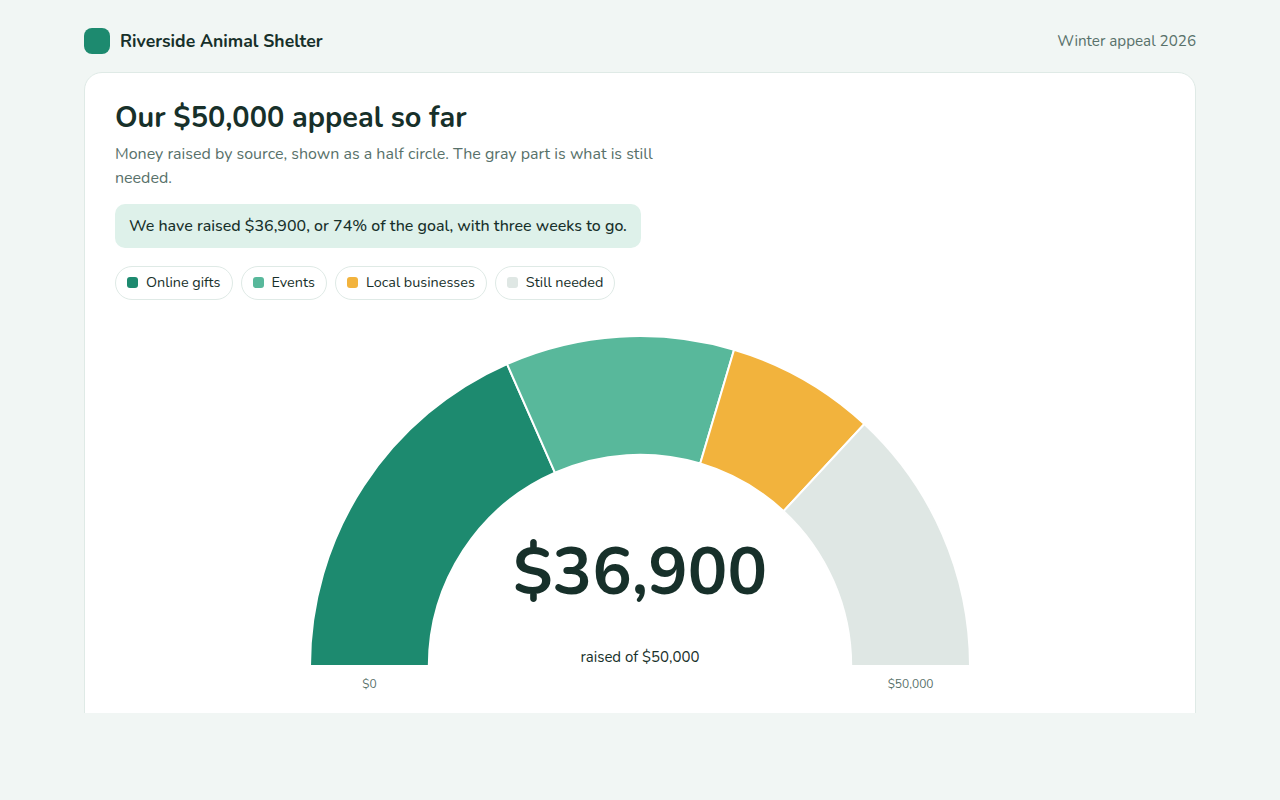
023. Semi Donut Chart
Example: a fundraising appeal and the money still needed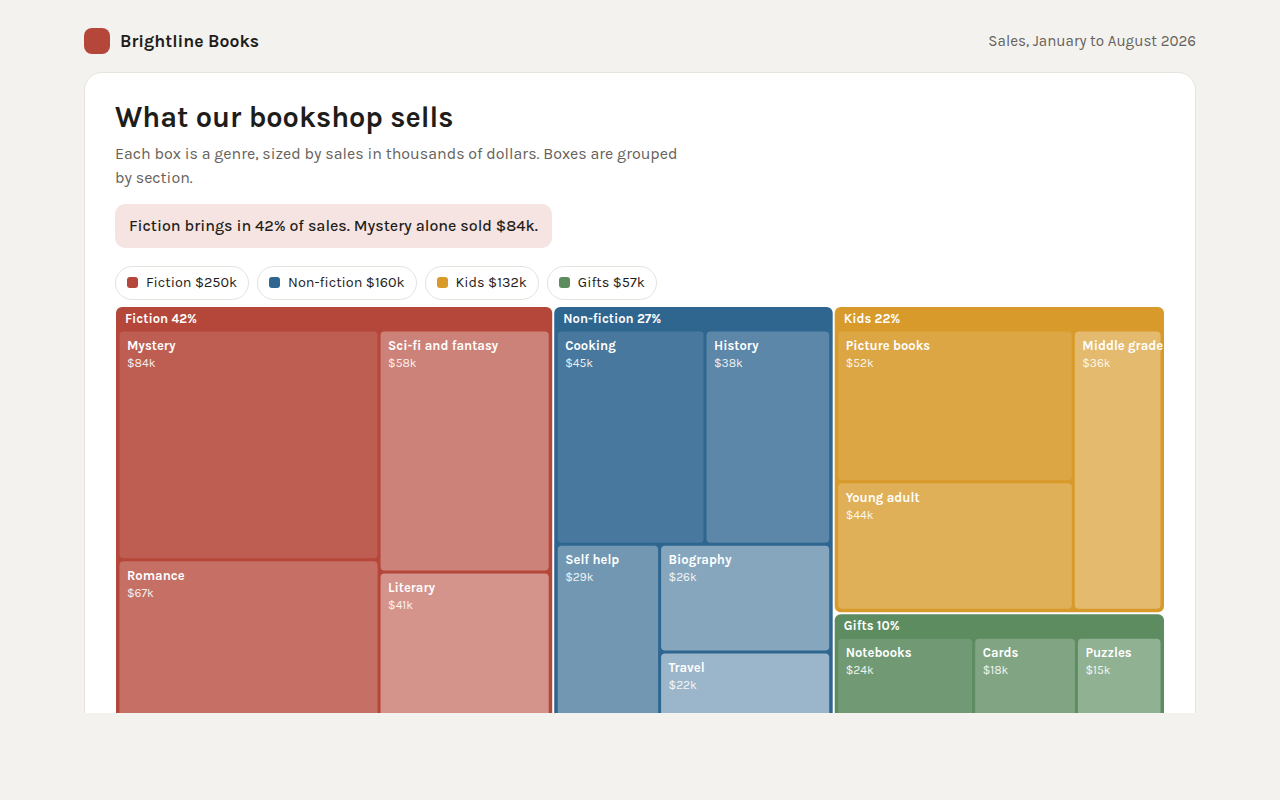
024. Treemap
Example: bookshop sales by section and genre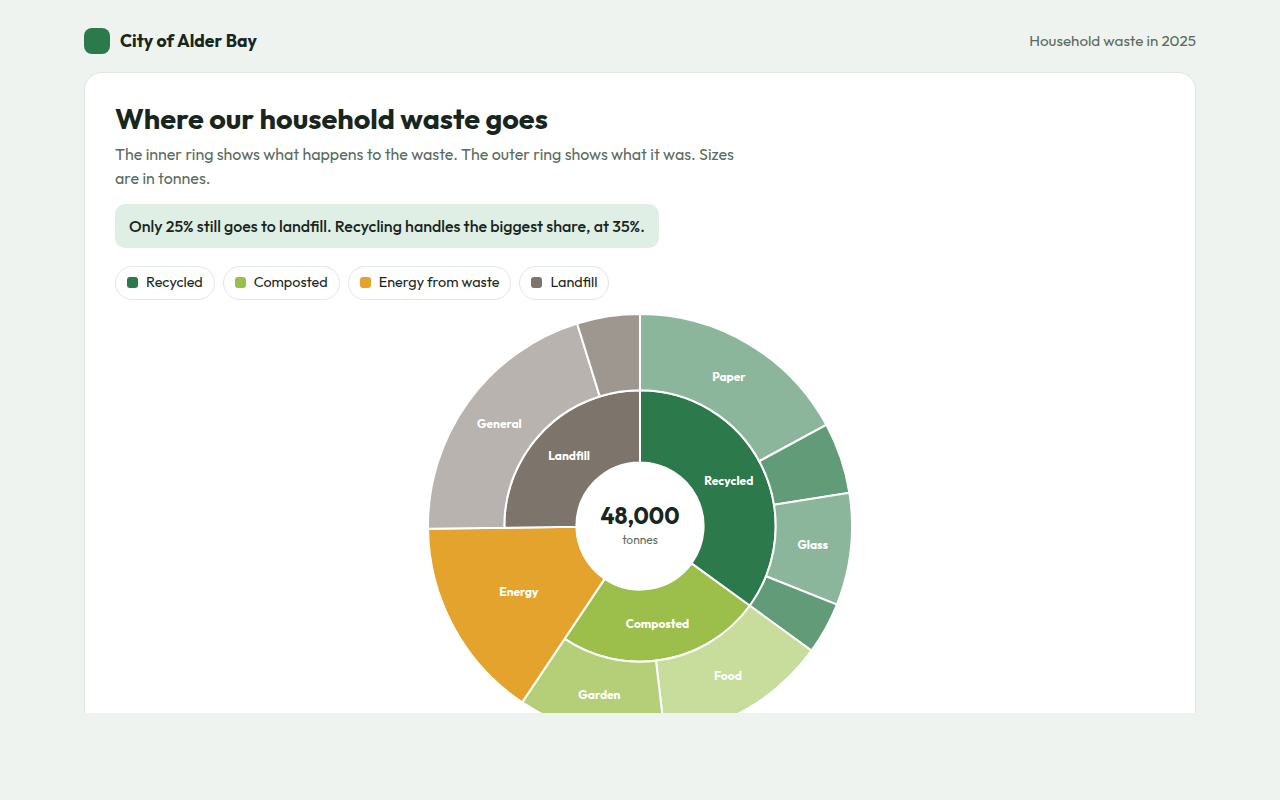
025. Sunburst Chart
Example: where a city sends its household waste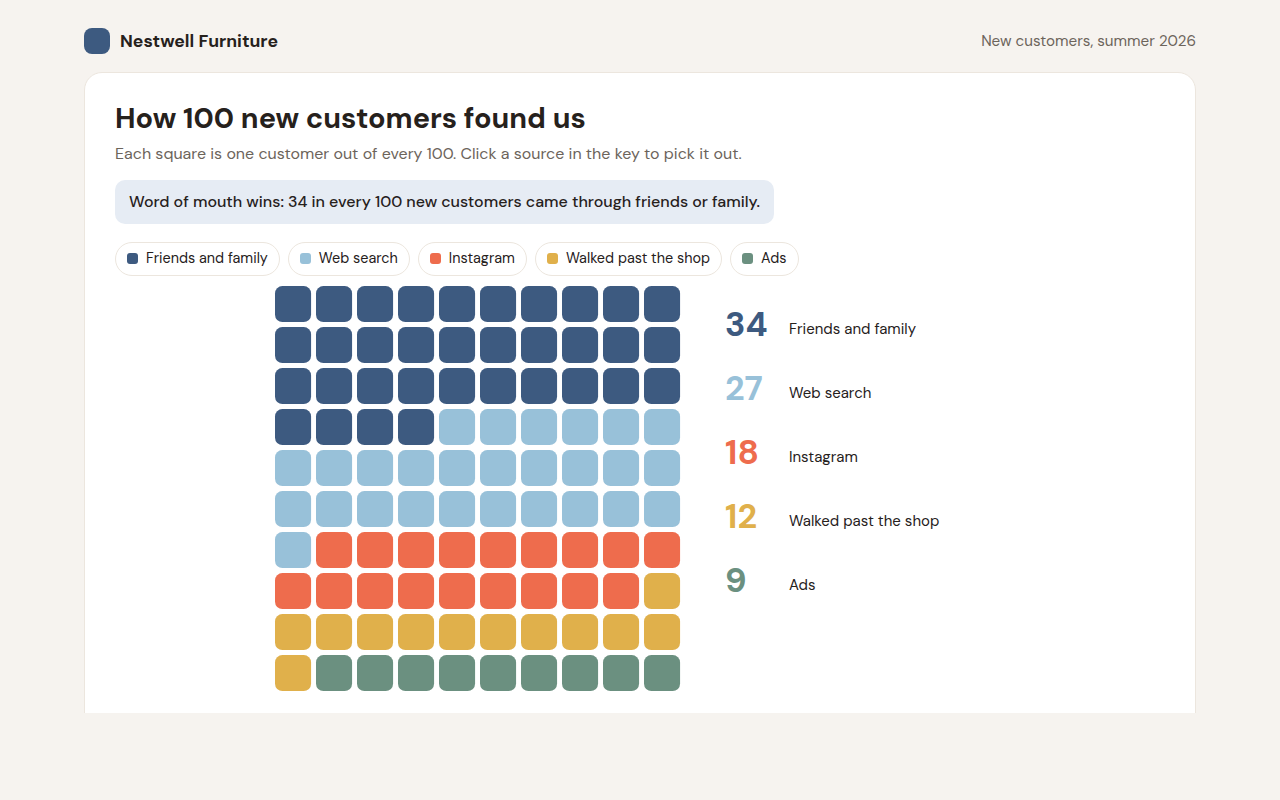
026. Waffle Chart
Example: how 100 new customers found a furniture shop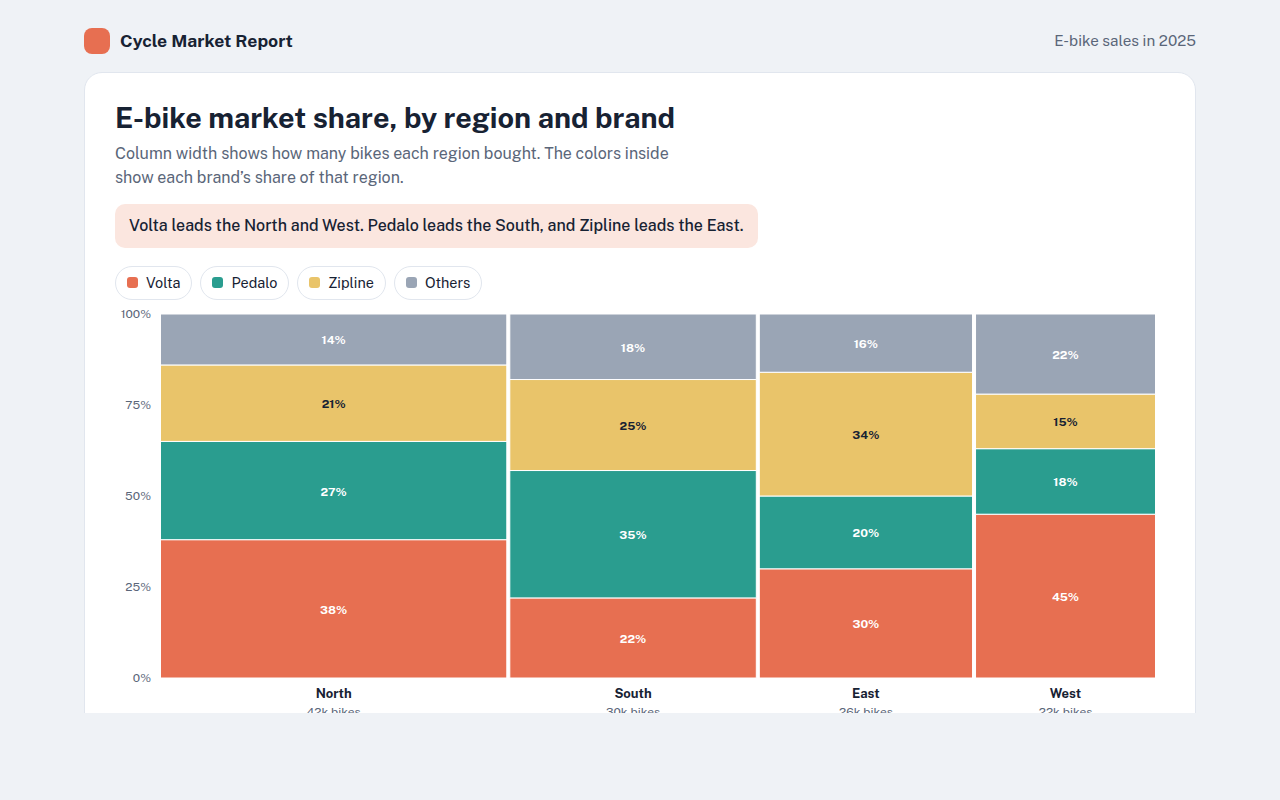
027. Marimekko Chart
Example: e-bike market share by region and brand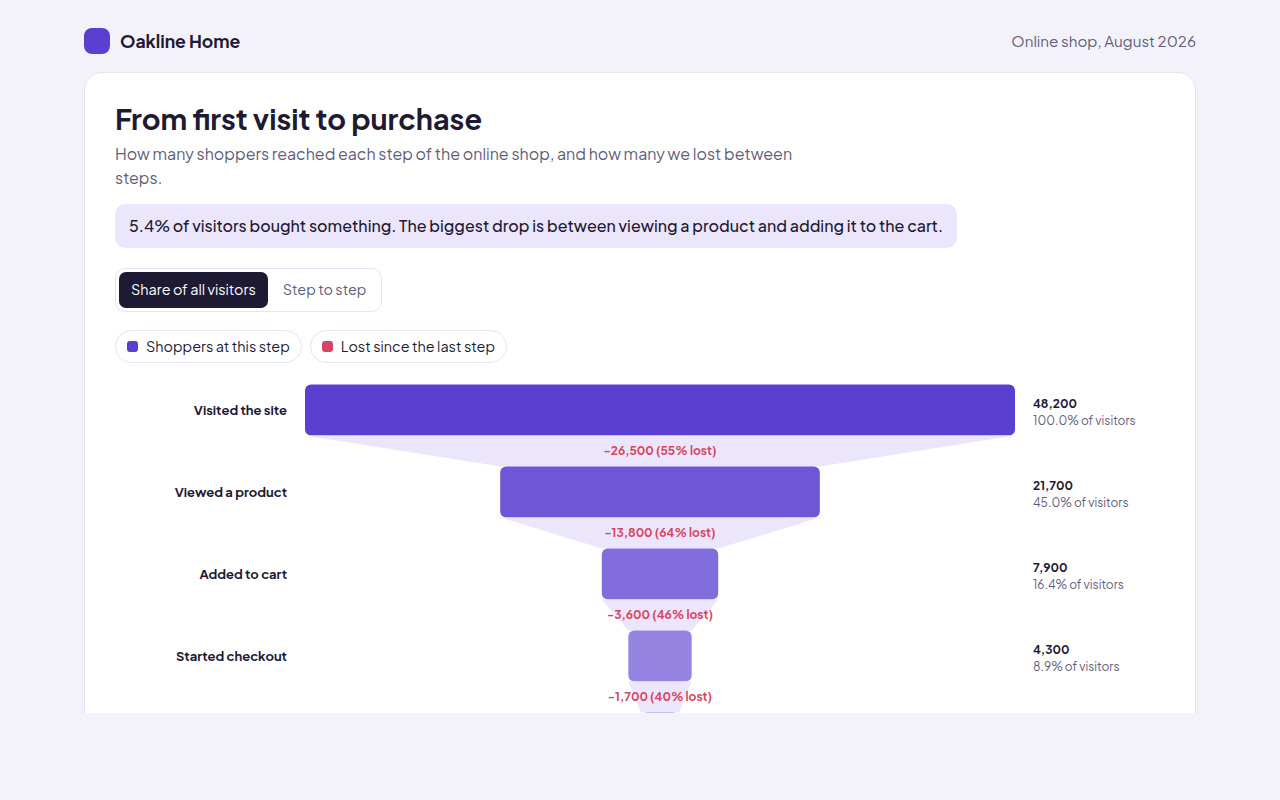
028. Funnel Chart
Example: shoppers moving from first visit to purchase in an online shop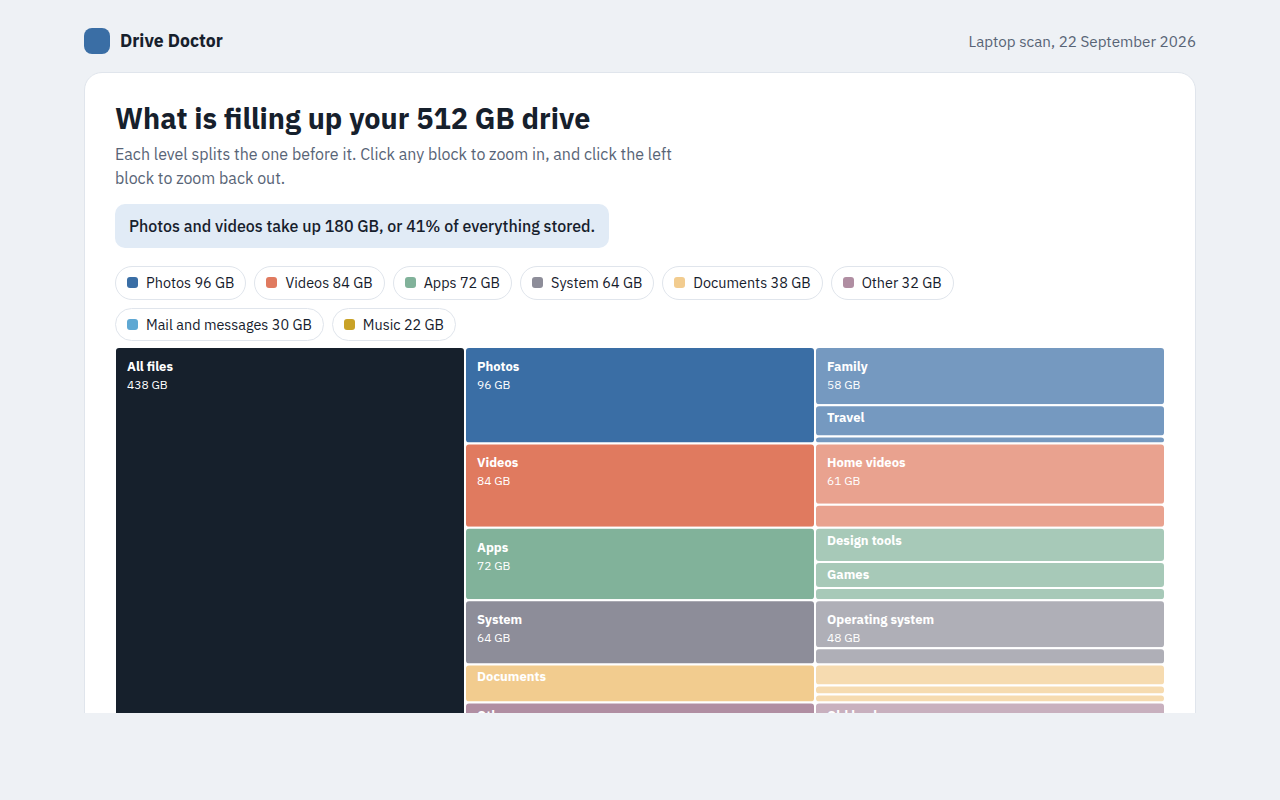
029. Icicle Chart
Example: what is filling up a laptop drive