Home / Part to Whole / Sunburst Chart
Sunburst Chart in HTML, CSS and JavaScript
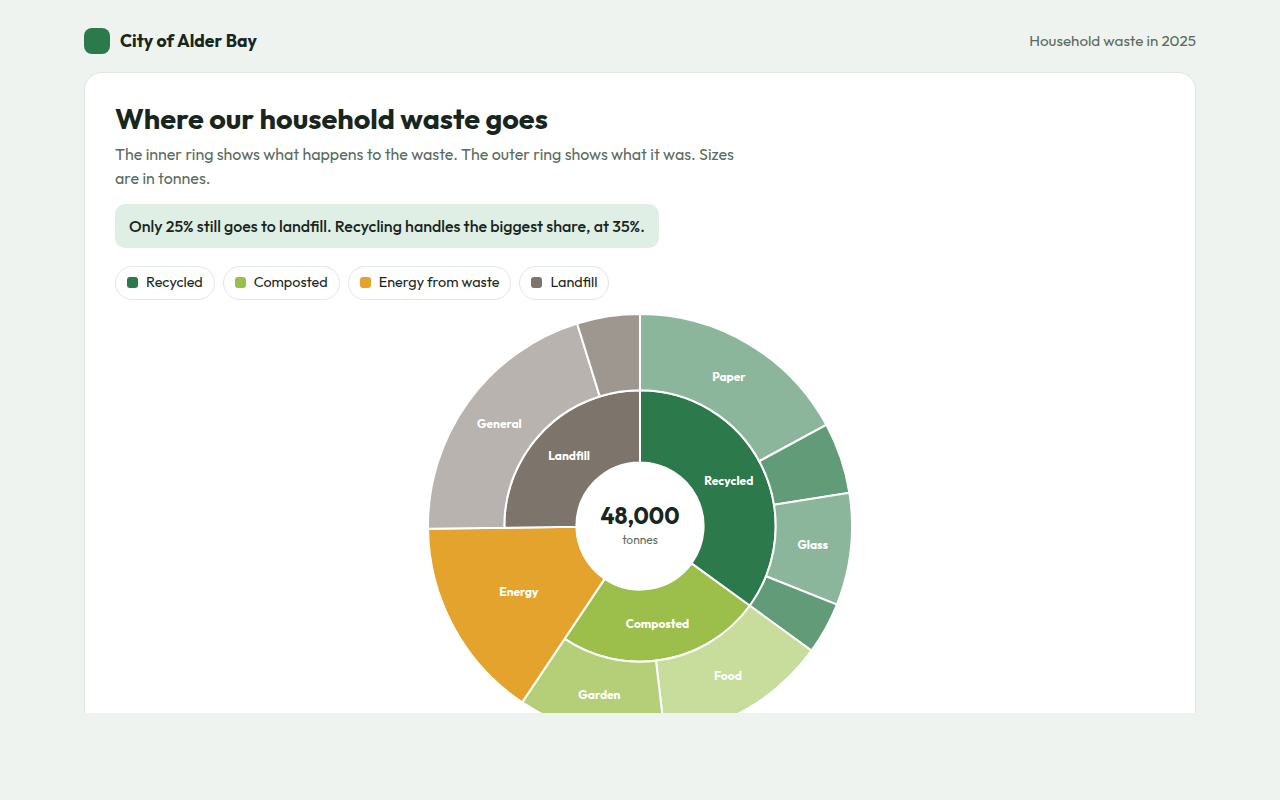
A sunburst chart shows nested data as rings. This free template draws one with plain SVG and vanilla JavaScript, no chart library. The example shows where a city sends its household waste.
What is a sunburst chart?
A sunburst chart shows nested data as rings. The inner ring holds the main groups, and each outer ring splits those groups into smaller parts. The angle of each piece shows its share of the whole.
It is like a pie chart with extra layers. You can see the big split first and then follow any piece outward to see what it is made of, like recycled waste splitting into paper, plastic, glass and metal.
At a glance
- Best for
- Two or three levels of nested shares
- Data you need
- A group, a part and a value for each item
- Skip it when
- Comparing sizes in the outer ring exactly.
- Made with
- HTML, CSS and vanilla JavaScript. No library.
When to use a sunburst chart
- Waste, energy or water broken down by type
- Budget by department and team
- Website traffic by channel and source
- Survey answers by group and subgroup
When to pick another chart
- Treemap: you want to use space more efficiently
- Donut Chart: you only have one level of data
What you get in this template
- Two rings drawn with SVG arc paths
- A piece with no parts can fill both rings
- The center shows the total, then the share of whatever you point at
- Names inside pieces that have enough room
- The rings sweep open on load
- Keyboard support and a full data table
How the code works
Here is a short version of the idea behind this sunburst chart. The full file adds the axis, labels, tooltips, sorting and resizing on top of it.
const groups = [
  { color: '#2c7a4b', kids: [8200, 2600, 4100, 1900] },
  { color: '#7d746b', kids: [9800, 2300] }
];
const total = groups.flatMap(g => g.kids).reduce((a, b) => a + b, 0);
const cx = 200, cy = 150;
const pt = (r, a) => (cx + r * Math.sin(a)) + ',' + (cy - r * Math.cos(a));
const arc = (r0, r1, a0, a1, fill) => make('path', { fill, stroke: '#fff', d: 'M' + pt(r1, a0) + 'A' + r1 + ',' + r1 + ' 0 ' + (a1 - a0 > Math.PI ? 1 : 0) + ' 1 ' + pt(r1, a1) + 'L' + pt(r0, a1) + 'A' + r0 + ',' + r0 + ' 0 ' + (a1 - a0 > Math.PI ? 1 : 0) + ' 0 ' + pt(r0, a0) + 'Z' });
let a = 0;

groups.forEach(g => {
  const sum = g.kids.reduce((s, v) => s + v, 0);
  arc(40, 90, a, a + sum / total * Math.PI * 2, g.color);   // inner ring
  g.kids.forEach(v => { const b = a + v / total * Math.PI * 2; arc(92, 140, a, b, g.color); a = b; }); // outer ring
});
The example uses four tiny helpers that create SVG shapes. Put them above the code and it runs as is.
const svg = document.querySelector('svg');
function make(tag, attrs) {
  const n = document.createElementNS('http://www.w3.org/2000/svg', tag);
  for (const k in attrs) n.setAttribute(k, attrs[k]);
  svg.appendChild(n);
  return n;
}
function drawRect(x, y, width, height, fill) { return make('rect', { x, y, width, height, fill }); }
function drawCircle(cx, cy, r, fill) { return make('circle', { cx, cy, r, fill }); }
function drawLine(x1, y1, x2, y2, stroke, width, dash) {
  return make('line', { x1, y1, x2, y2, stroke, 'stroke-width': width || 1, 'stroke-dasharray': dash || 'none' });
}
function drawText(x, y, str, anchor) {
  const t = make('text', { x, y, 'text-anchor': anchor || 'start' });
  t.textContent = str;
  return t;
}
How to add it to your website
- Download the file. Click Download HTML file above. You get one file called sunburst-chart.html with everything inside.
- Change the data. Open the file in any code editor and find the DATA list near the bottom. Replace the names and numbers with your own.
- Change the colors and text. Colors are at the top of the style tag. The title, subtitle and main point are plain HTML near the top of the body.
- Put it online. Upload the file to any host, such as GitHub Pages, Netlify or your own server, or paste it into your site. There is no build step.
Questions people ask
What is a sunburst chart?
A sunburst chart is a set of rings that shows nested data. The inner ring holds the top level groups and each ring further out shows the parts inside them.
When should I use a sunburst chart?
Use it when your data has two or three levels and you want people to see both the big split and what each group is made of.
How is a sunburst different from a donut chart?
A donut chart has one ring. A sunburst has several, one for each level of the data.
How many rings should a sunburst chart have?
Two or three. Past that, the outer pieces get very thin and the chart is hard to read.
More part to whole
021. Pie Chart
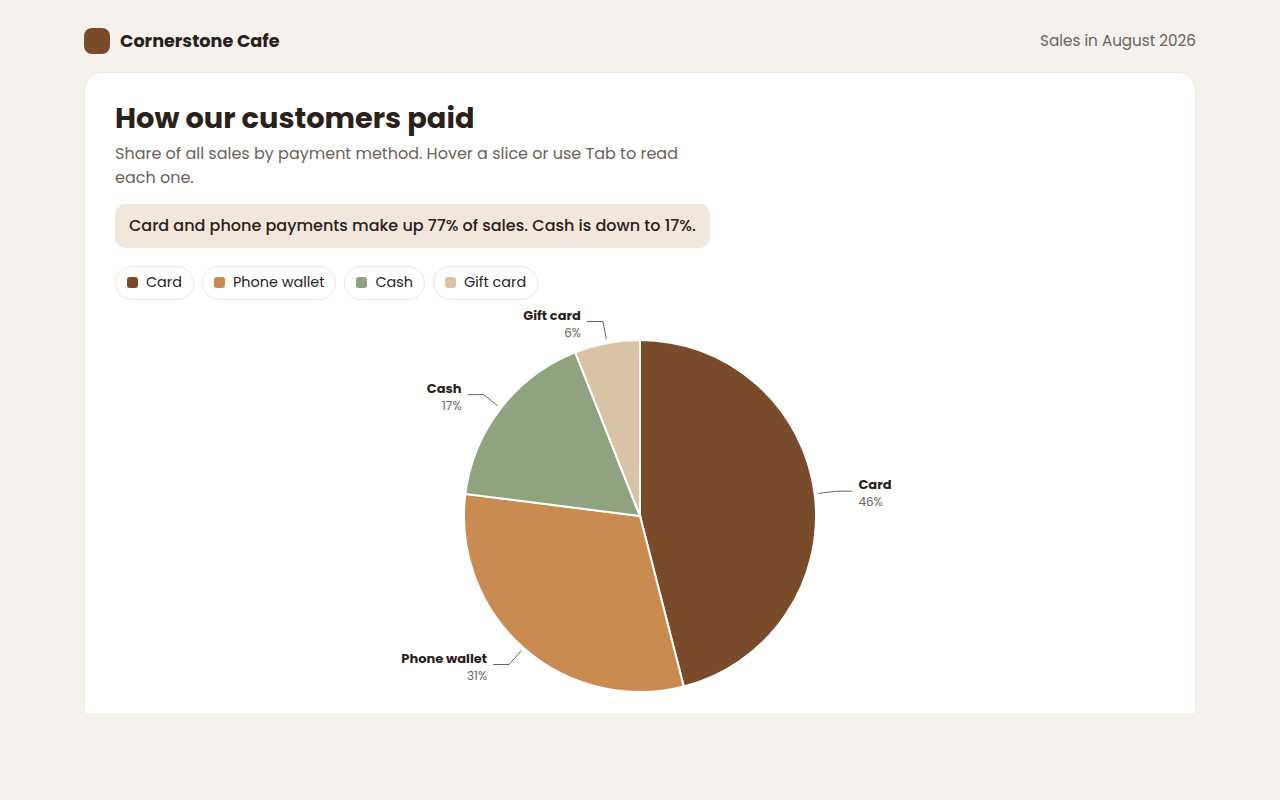
Example: how customers paid at a cafe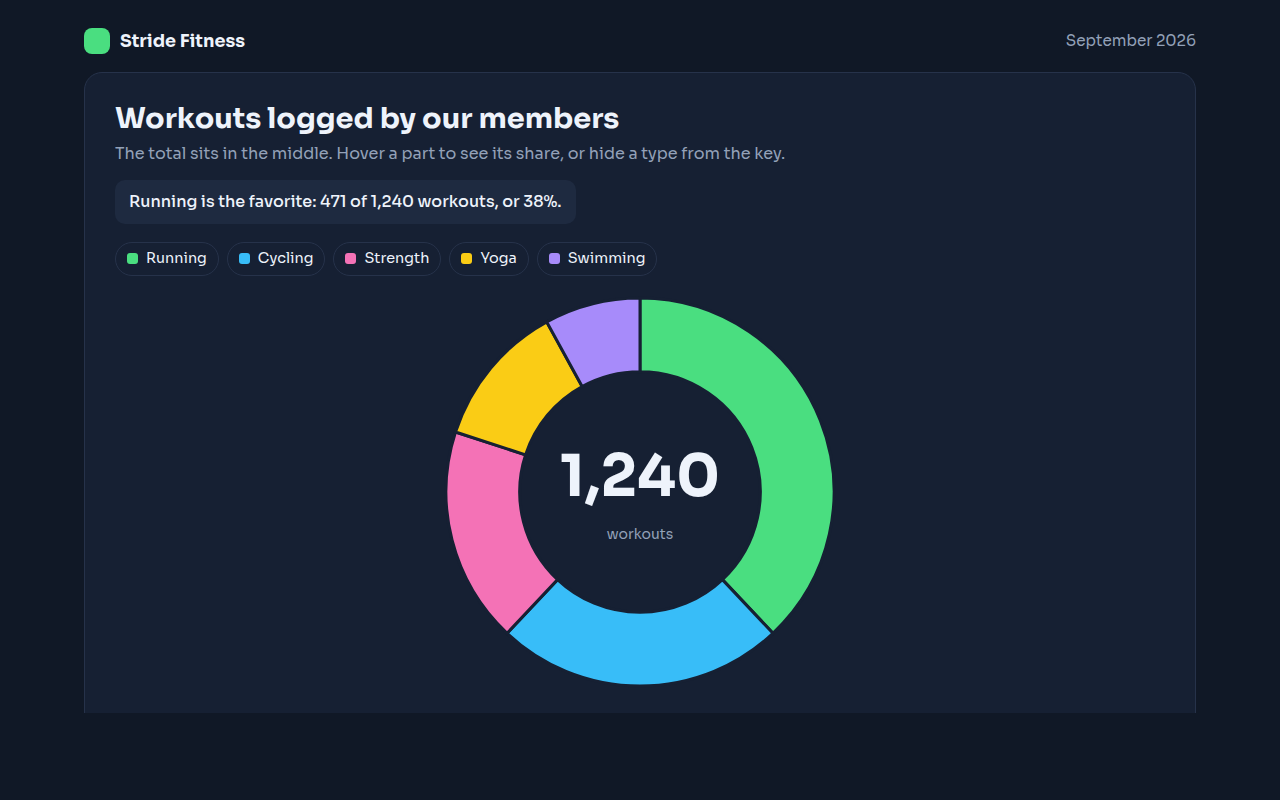
022. Donut Chart
Example: workouts logged by members of a fitness app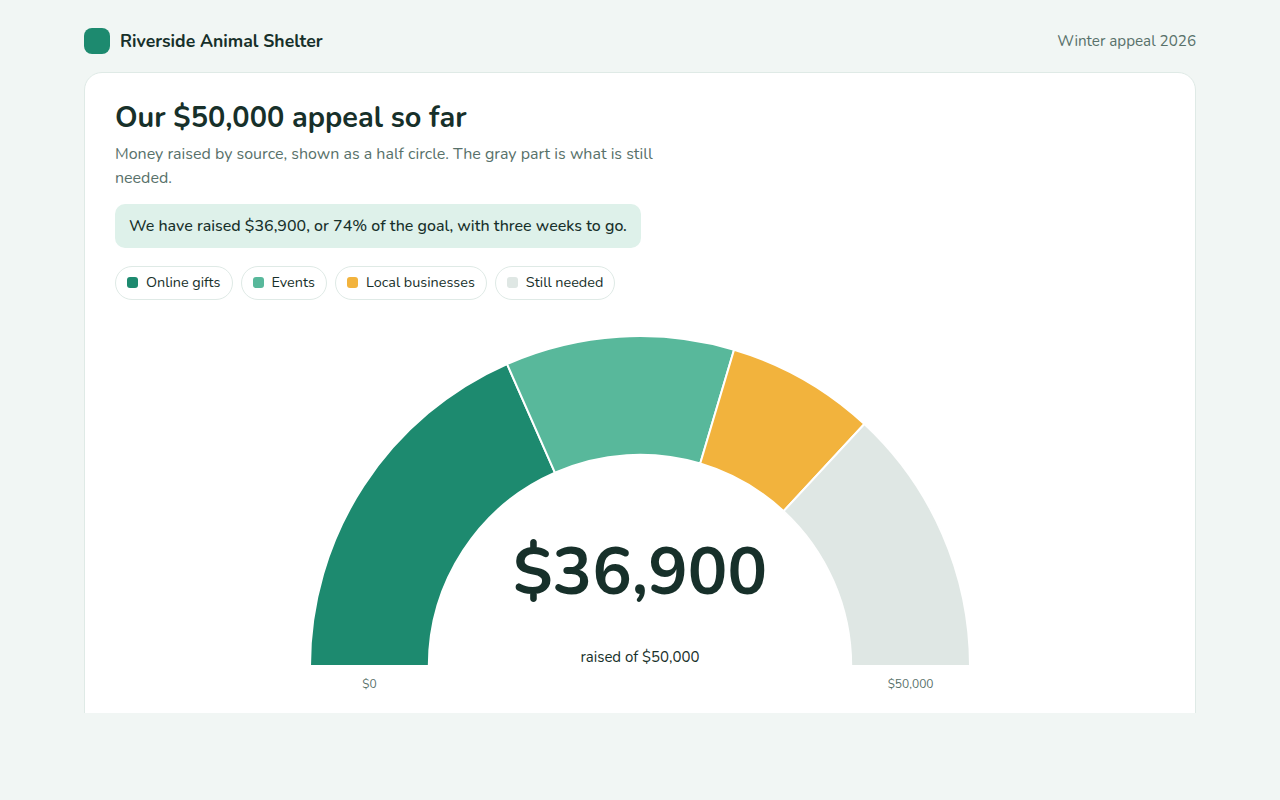
023. Semi Donut Chart
Example: a fundraising appeal and the money still needed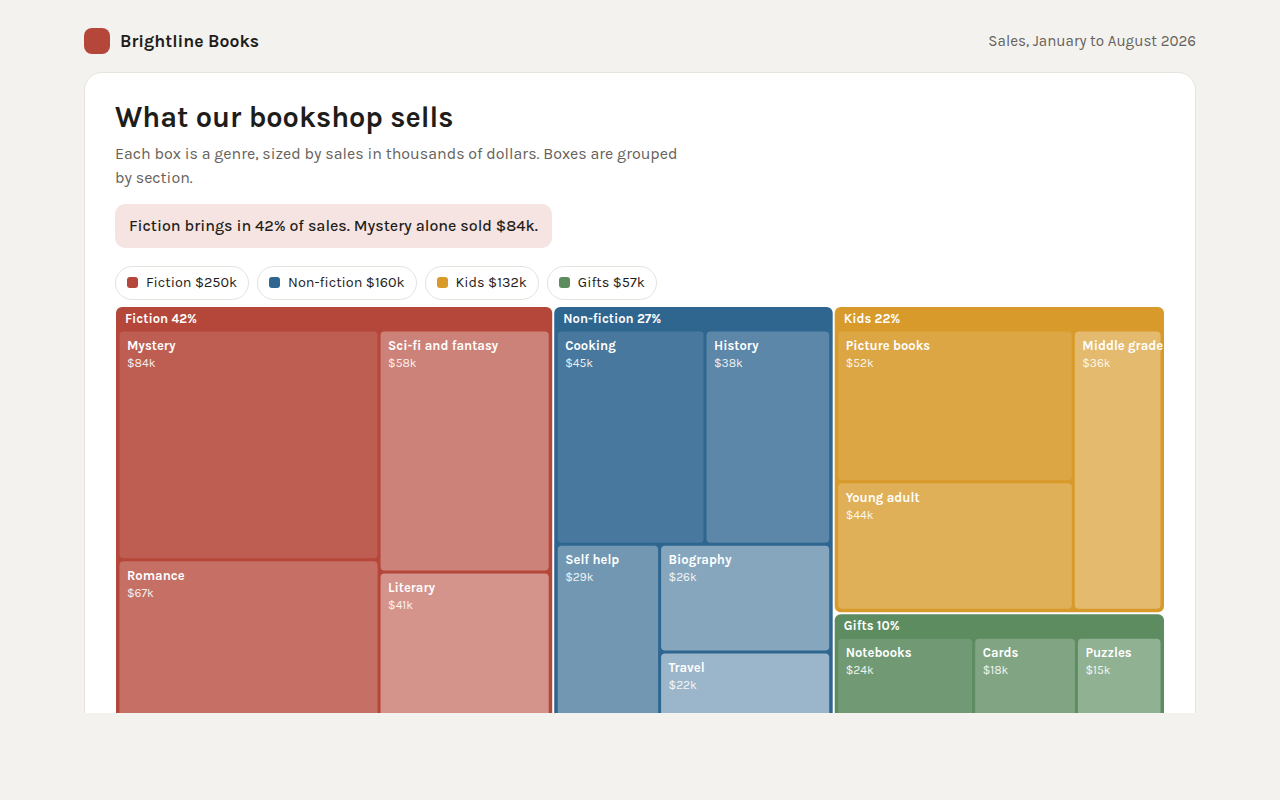
024. Treemap
Example: bookshop sales by section and genre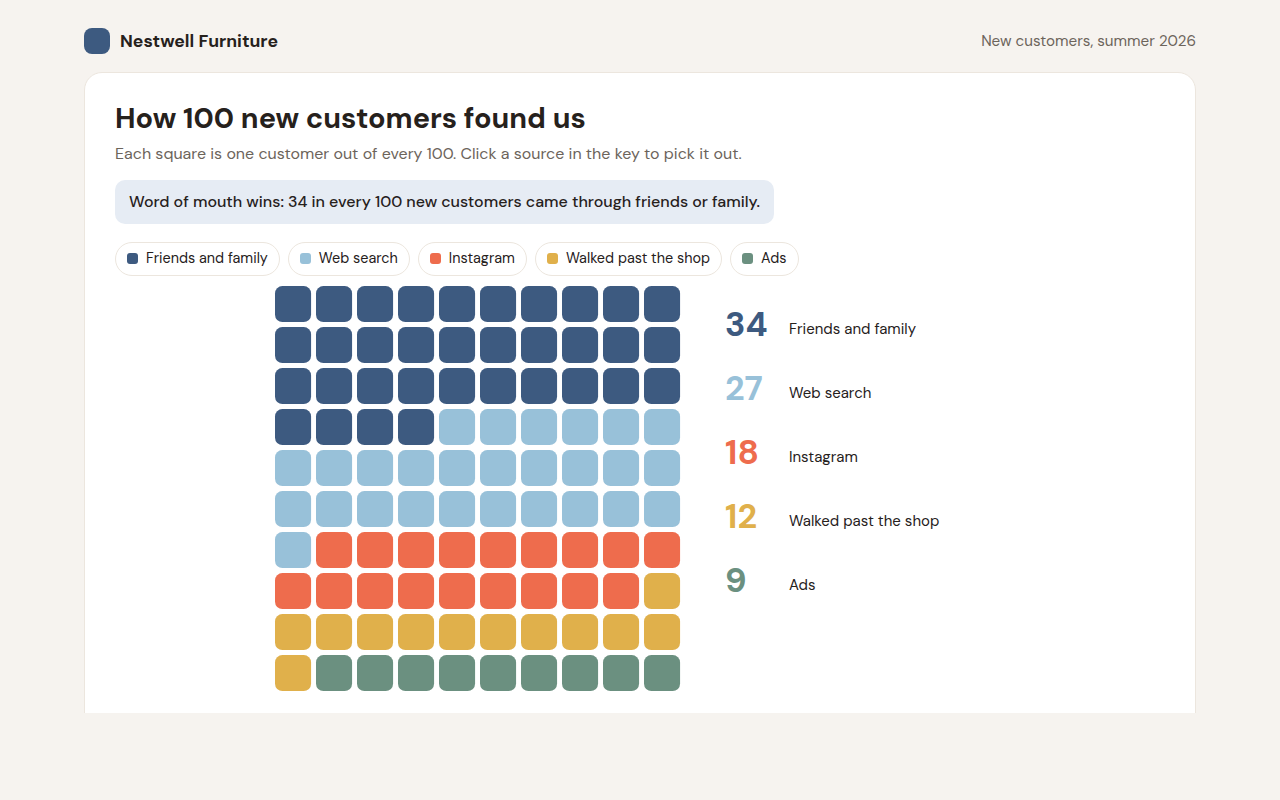
026. Waffle Chart
Example: how 100 new customers found a furniture shop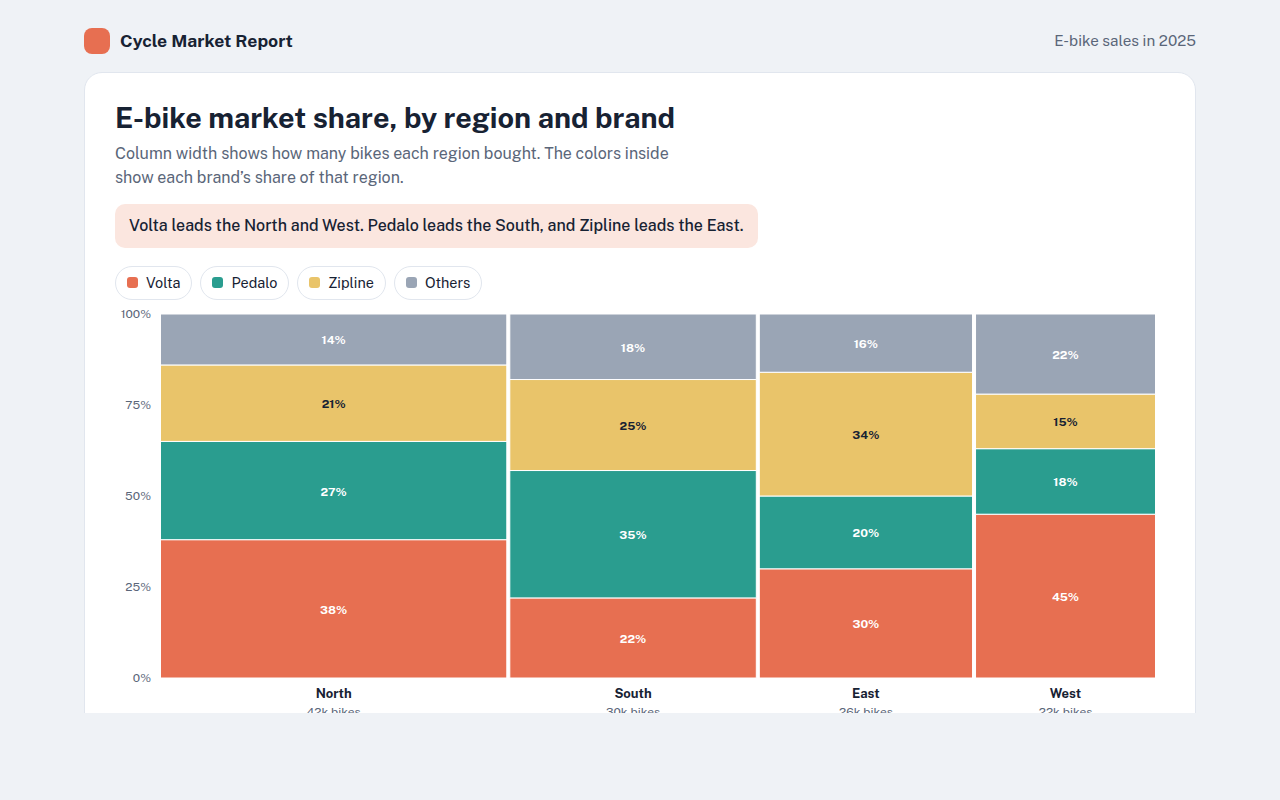
027. Marimekko Chart
Example: e-bike market share by region and brand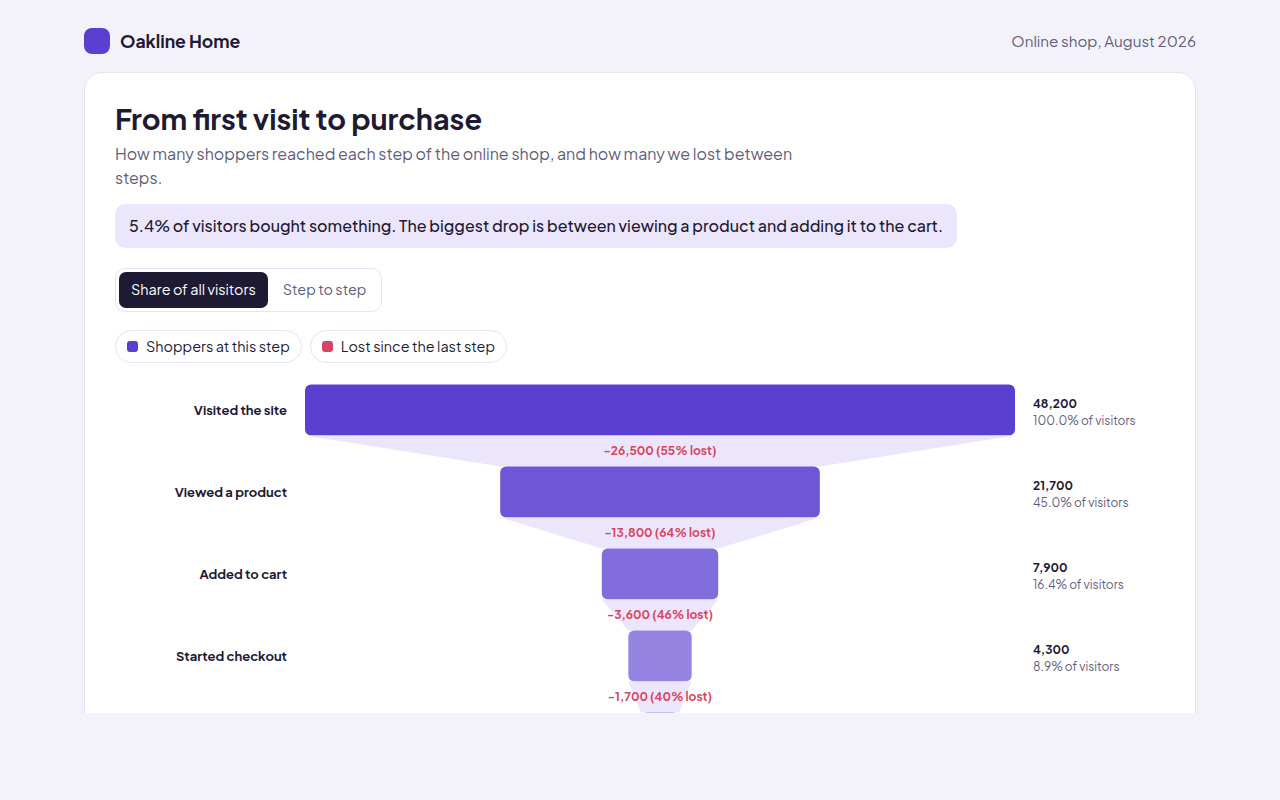
028. Funnel Chart
Example: shoppers moving from first visit to purchase in an online shop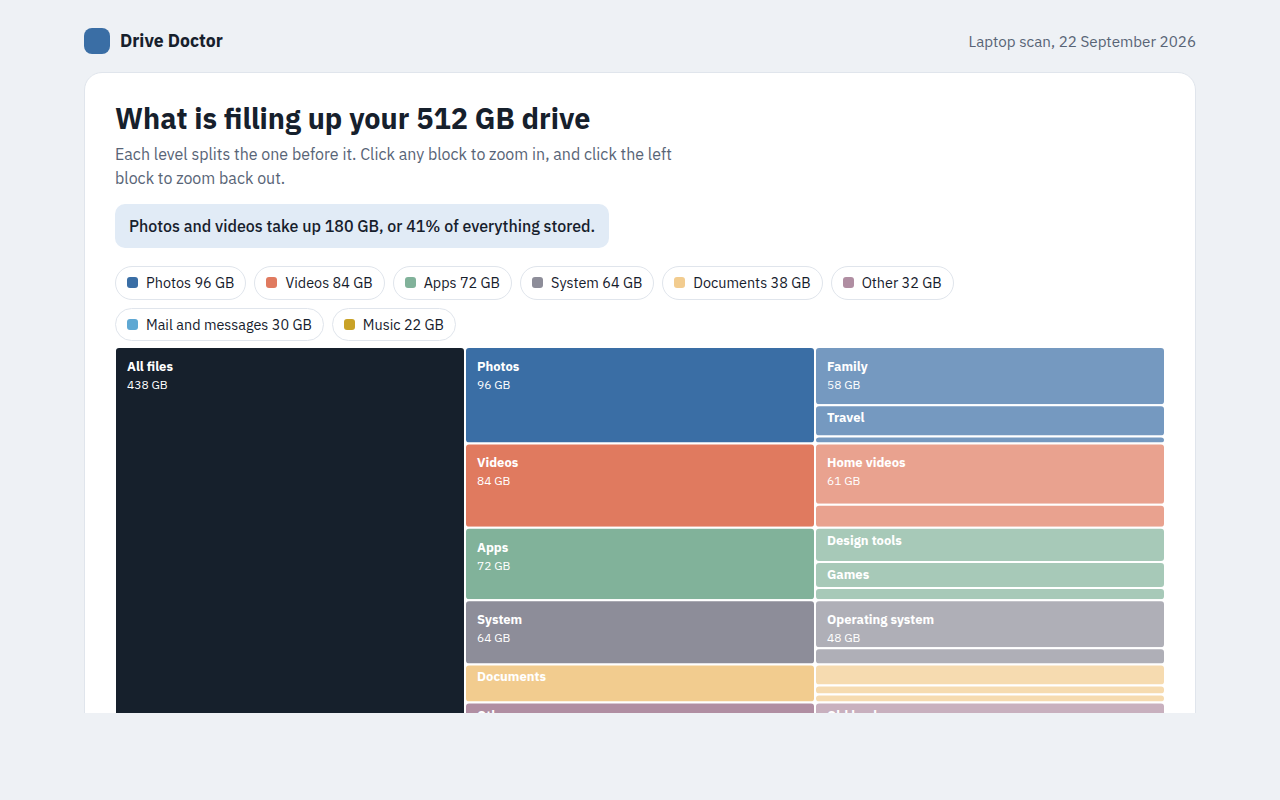
029. Icicle Chart
Example: what is filling up a laptop drive