70 free data charts you can put on any website
All 70 charts are live, in 7 categories. Every chart is drawn with plain HTML, CSS and vanilla JavaScript, with no chart library. Each one comes with a live demo, a clear guide on when to use it, the key code, and a single HTML file to download. Change the numbers, keep the design. Free for commercial use.
with live demos
No library. Just charts.
1. Comparison Charts
See all 10 comparison charts
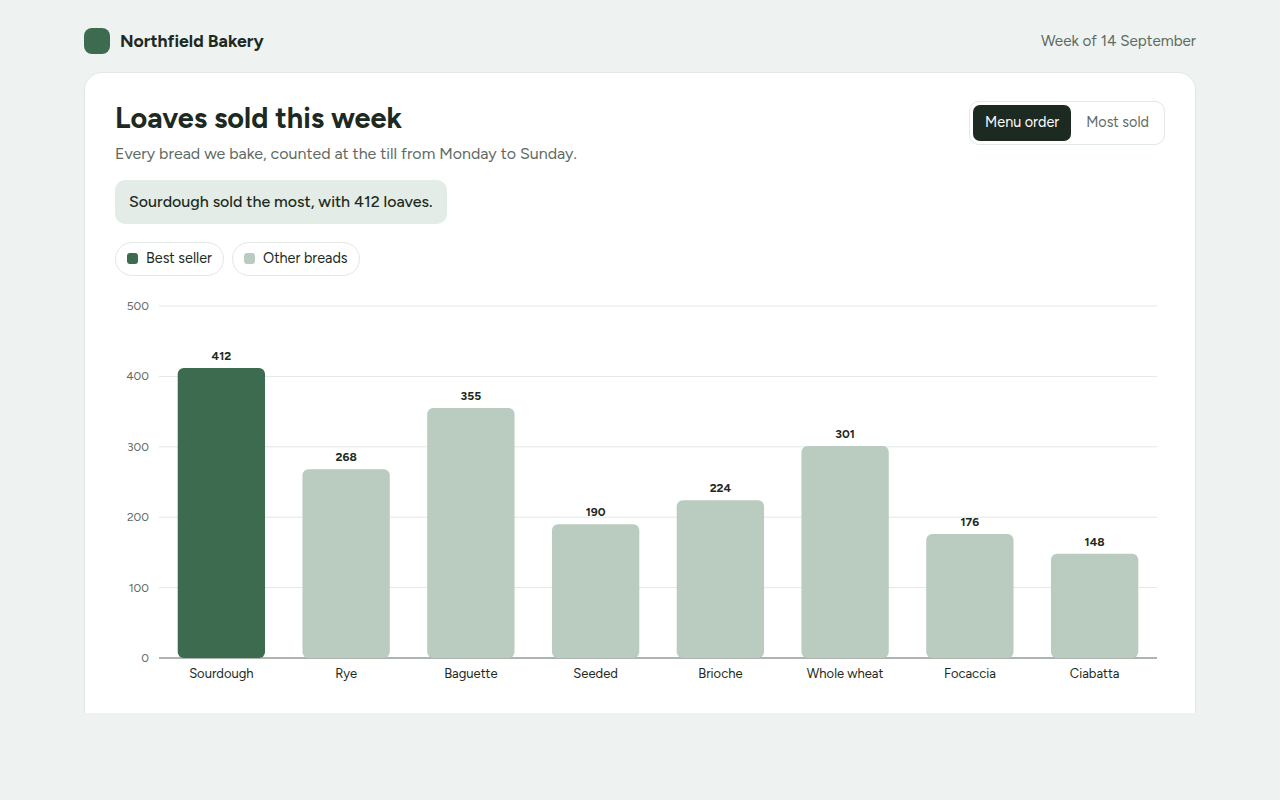
001. Bar Chart
Example: weekly bread sales at a bakery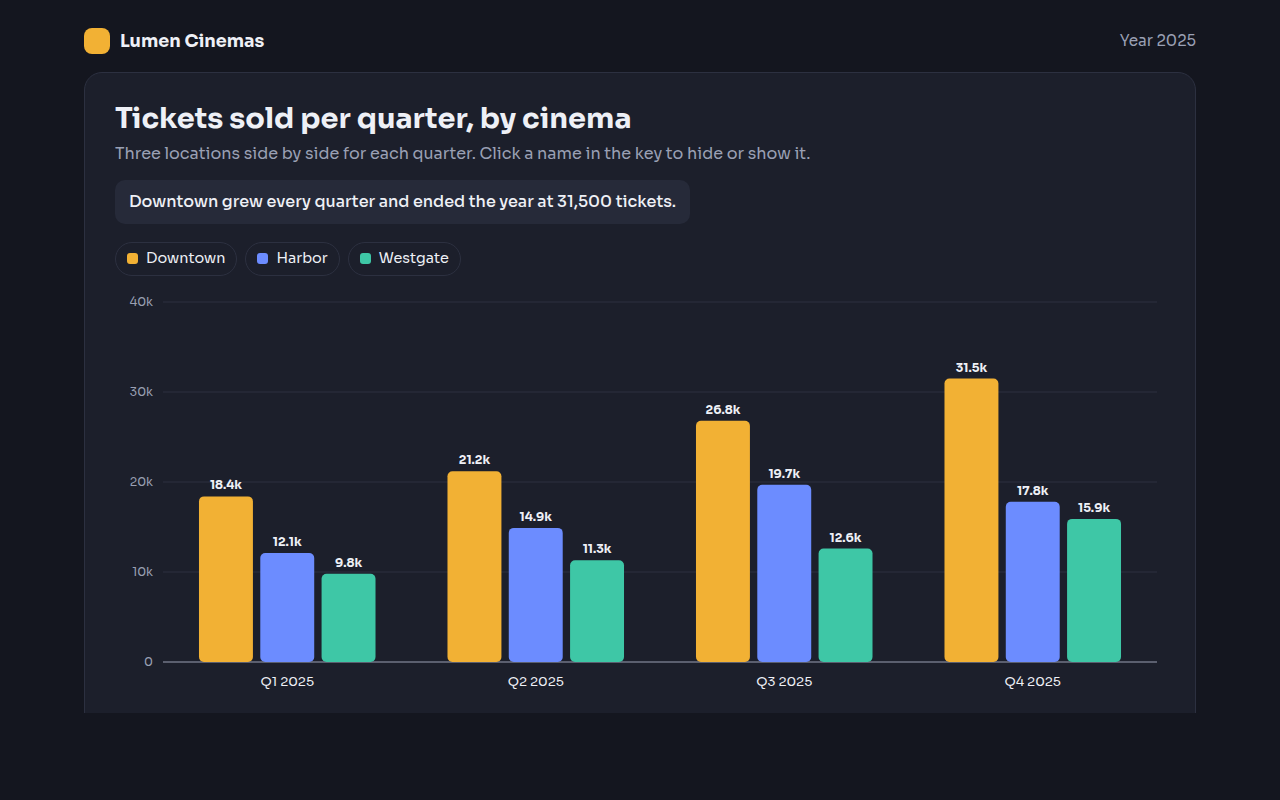
002. Grouped Bar Chart
Example: cinema ticket sales for three locations per quarter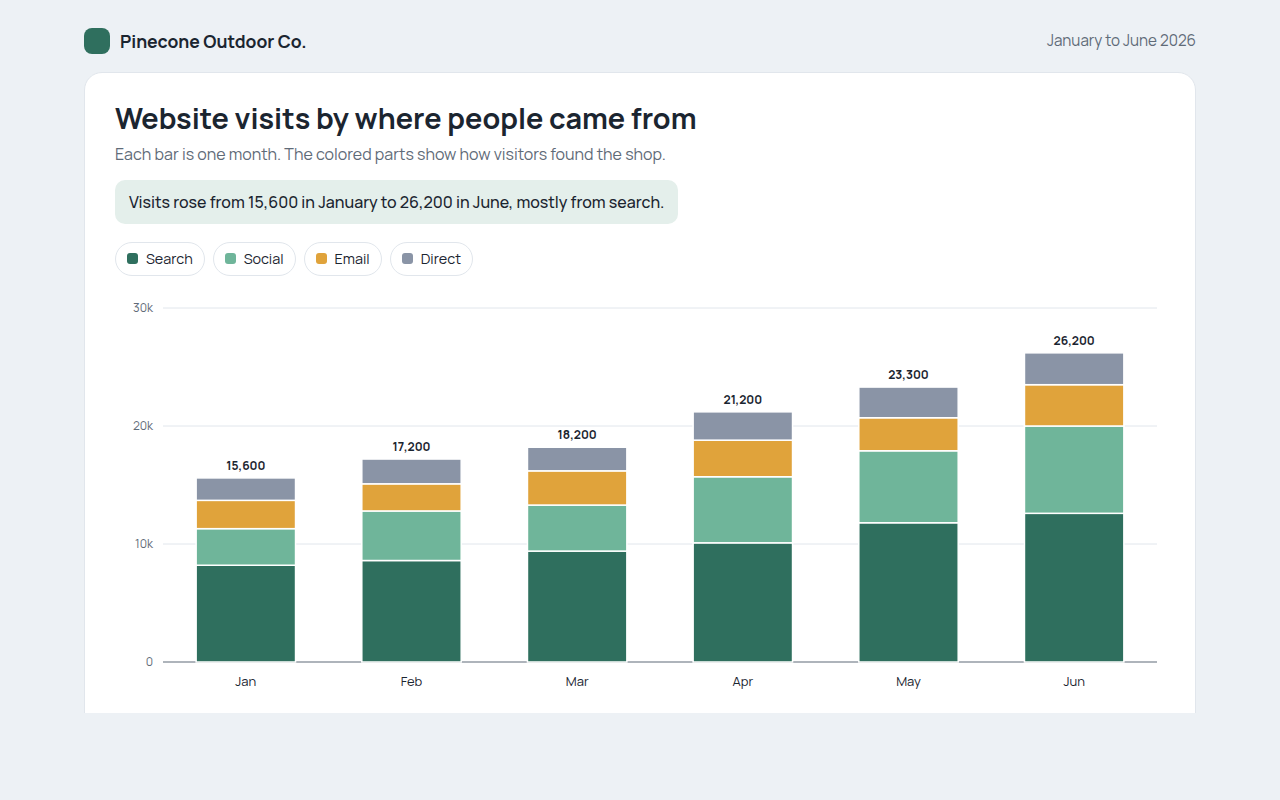
003. Stacked Bar Chart
Example: website visits by source for an outdoor shop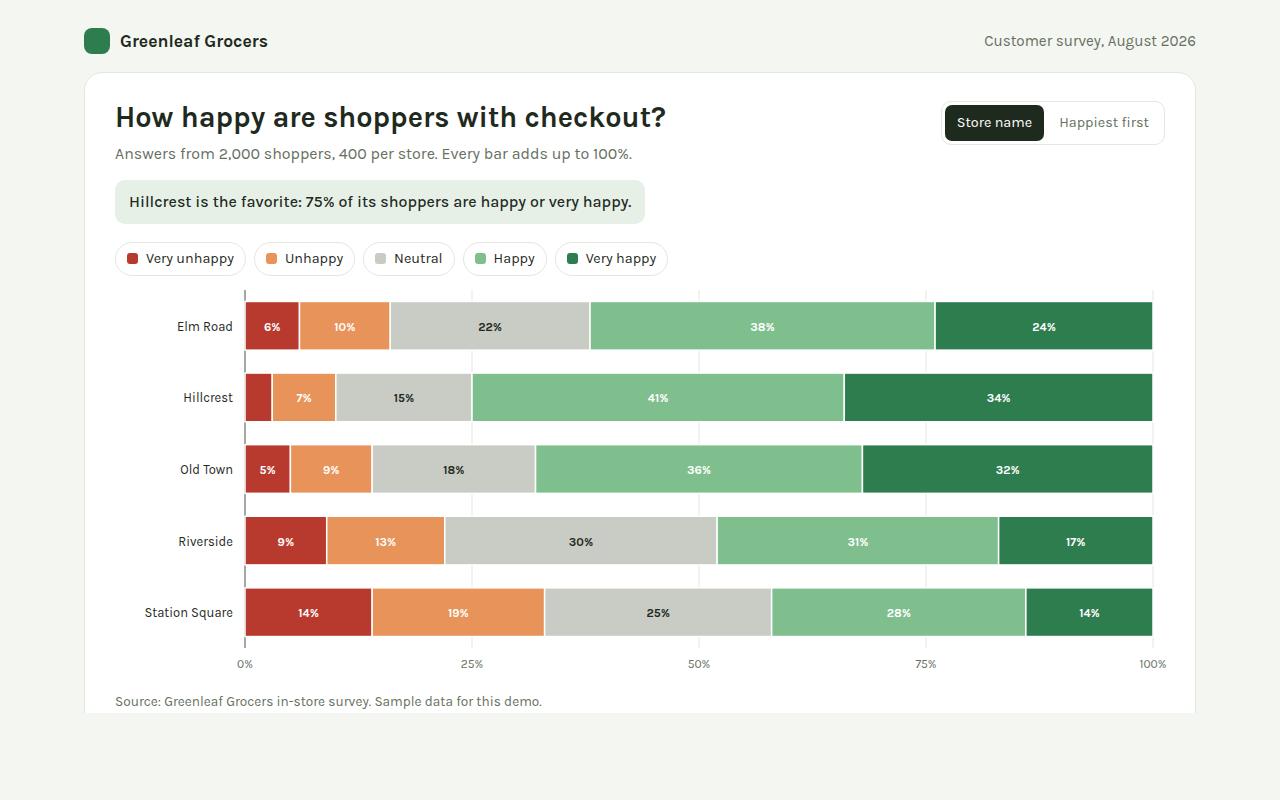
004. 100% Stacked Bar Chart
Example: customer survey results for five grocery stores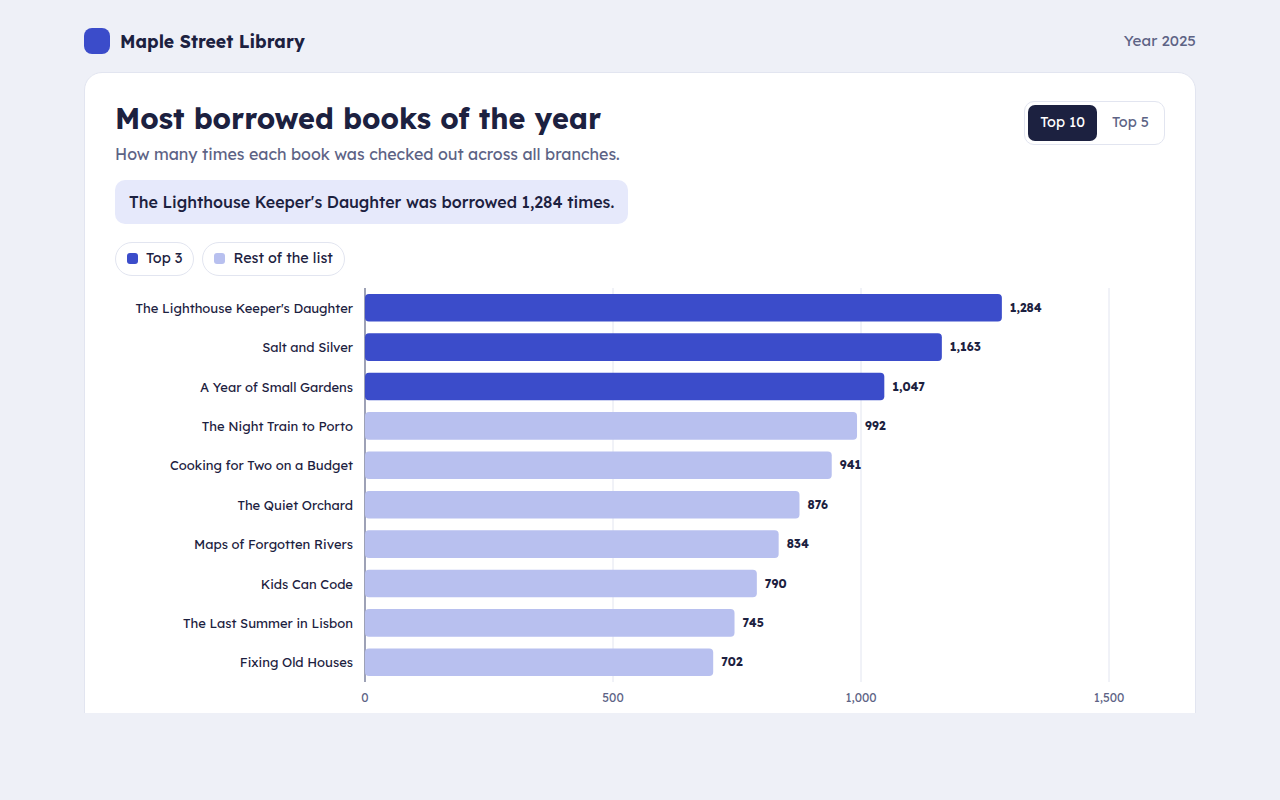
005. Horizontal Bar Chart
Example: the most borrowed library books of the year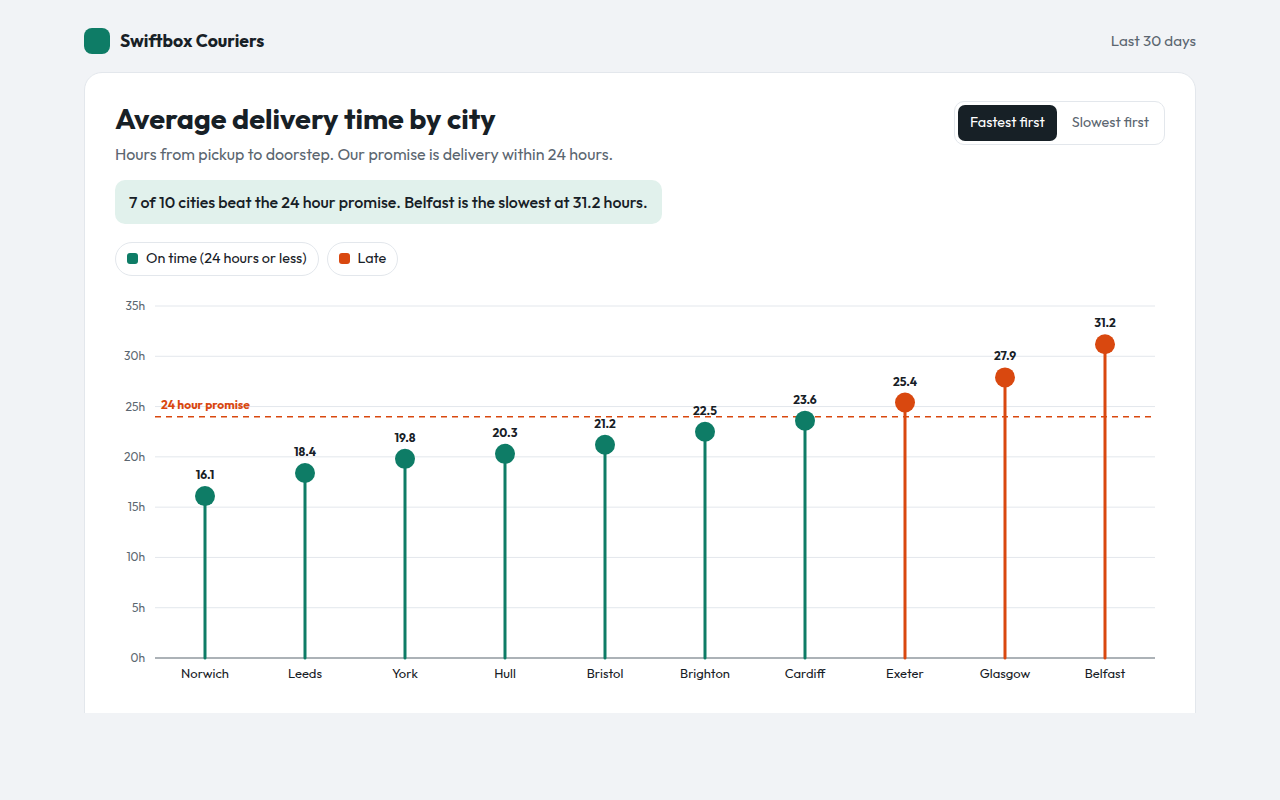
006. Lollipop Chart
Example: average delivery time by city with a 24 hour target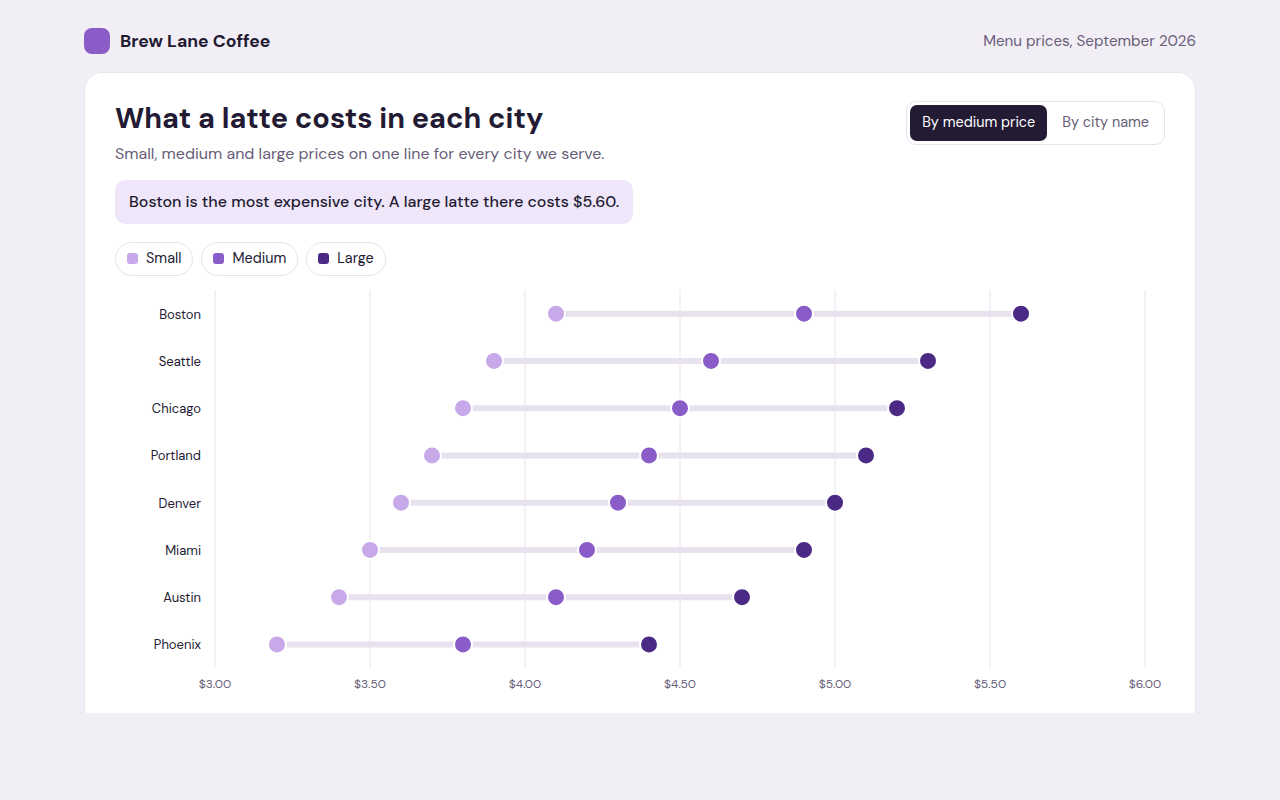
007. Dot Plot
Example: small, medium and large latte prices in eight cities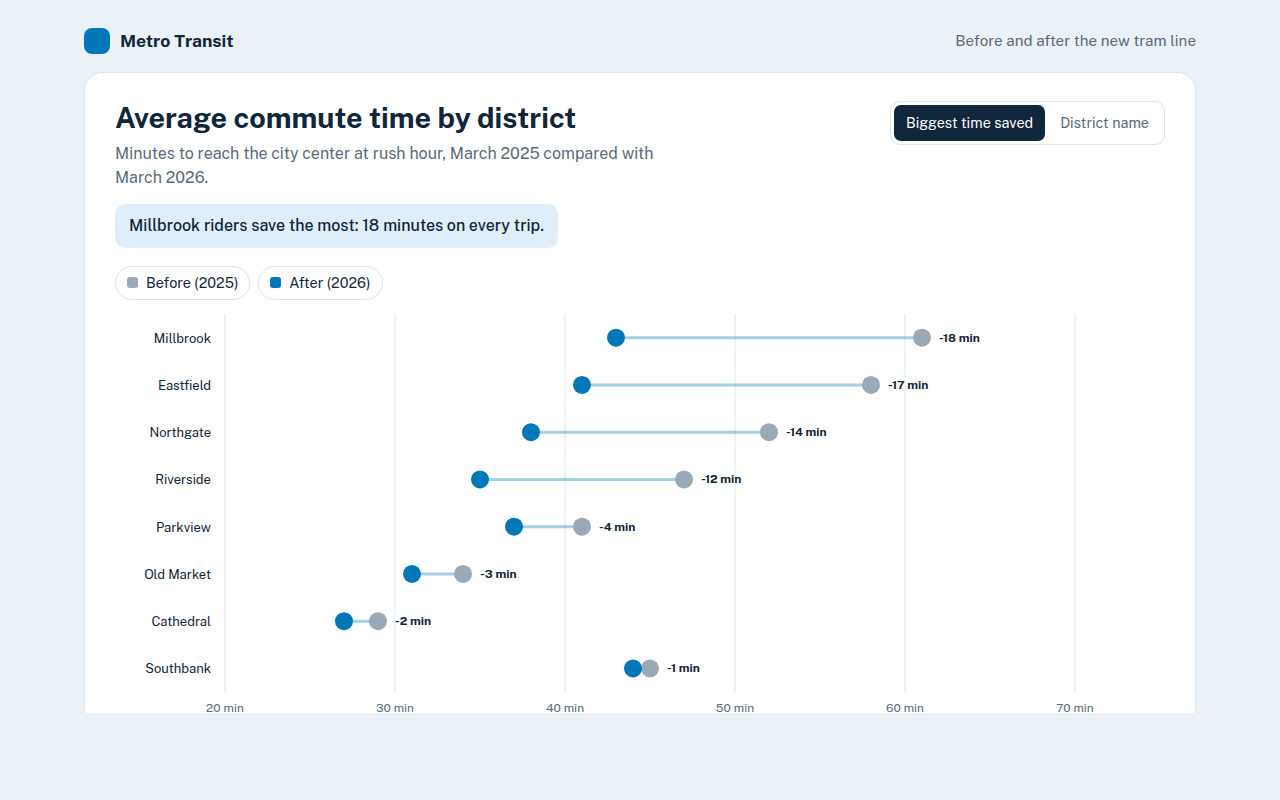
008. Dumbbell Chart
Example: commute times before and after a new tram line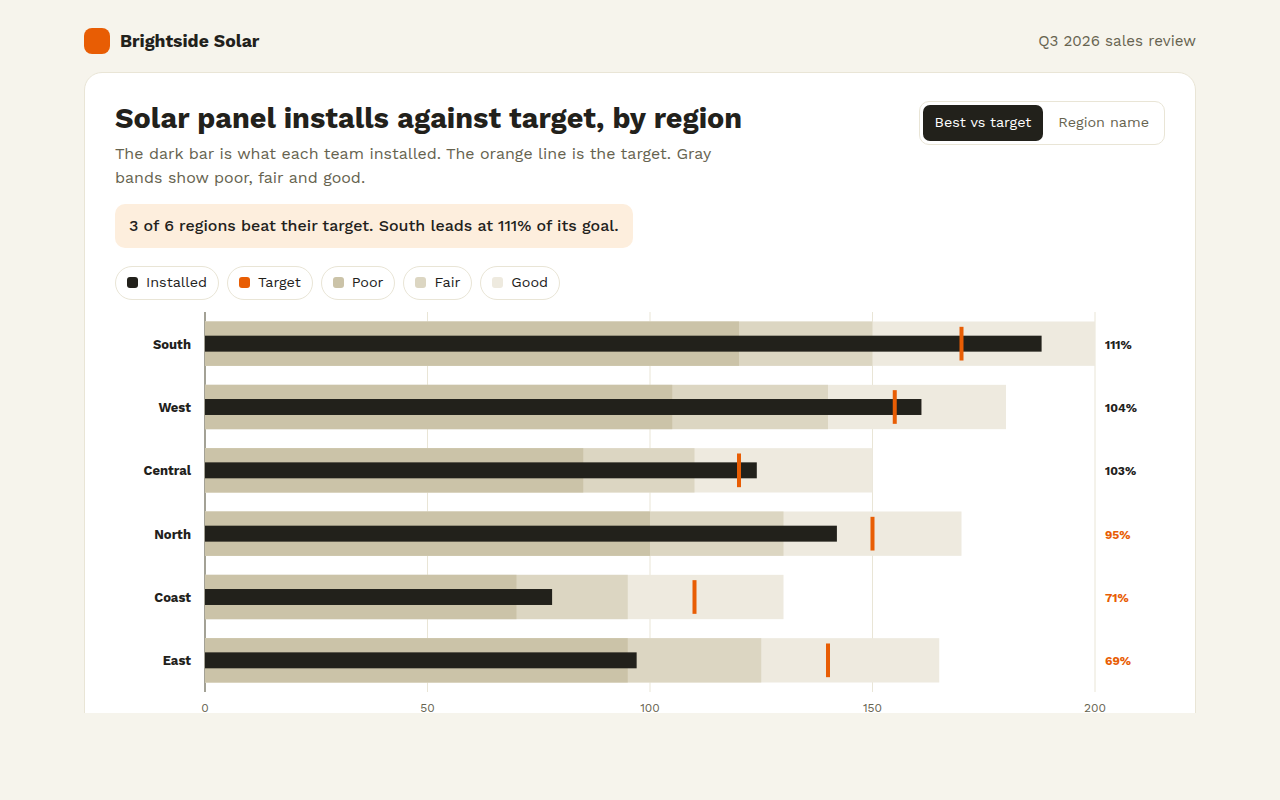
009. Bullet Chart
Example: solar panel installs against target for six regions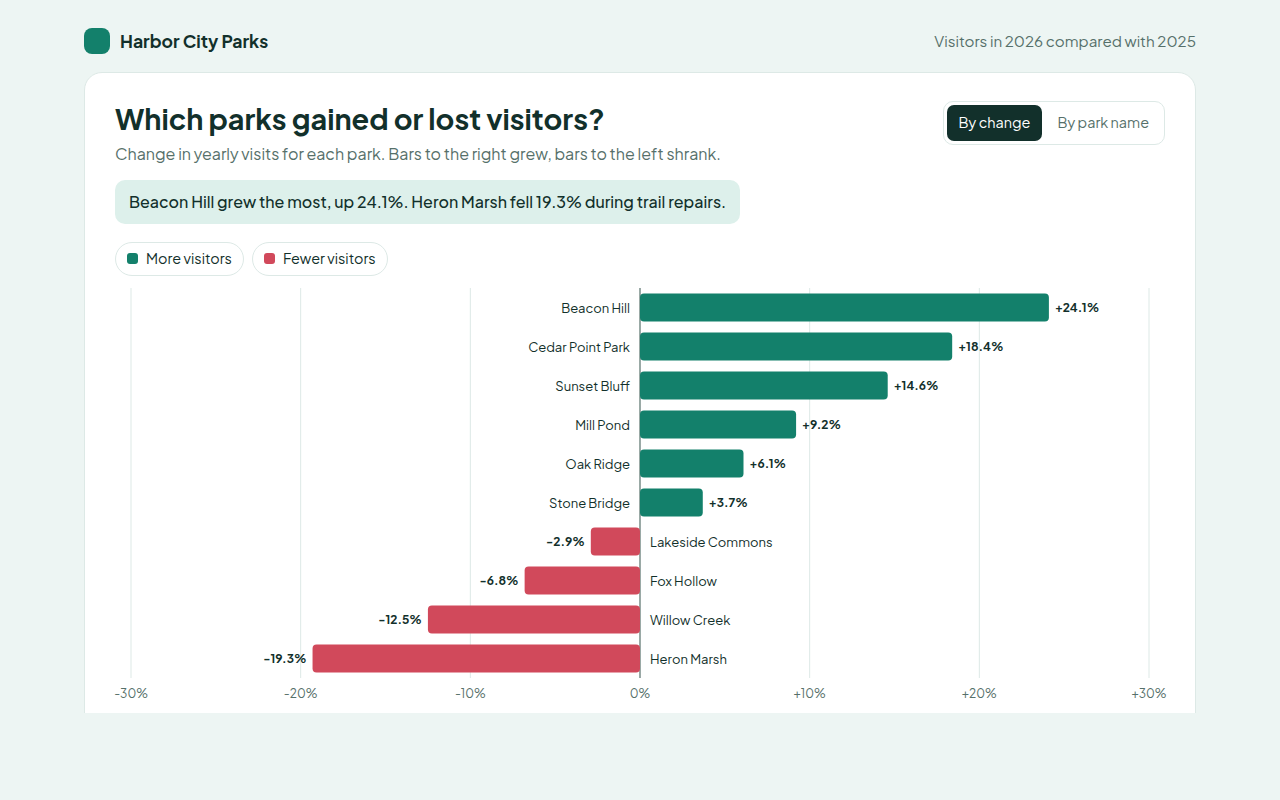
010. Diverging Bar Chart
Example: visitor gains and losses for ten city parks2. Trends Over Time
See all 10 trends over time
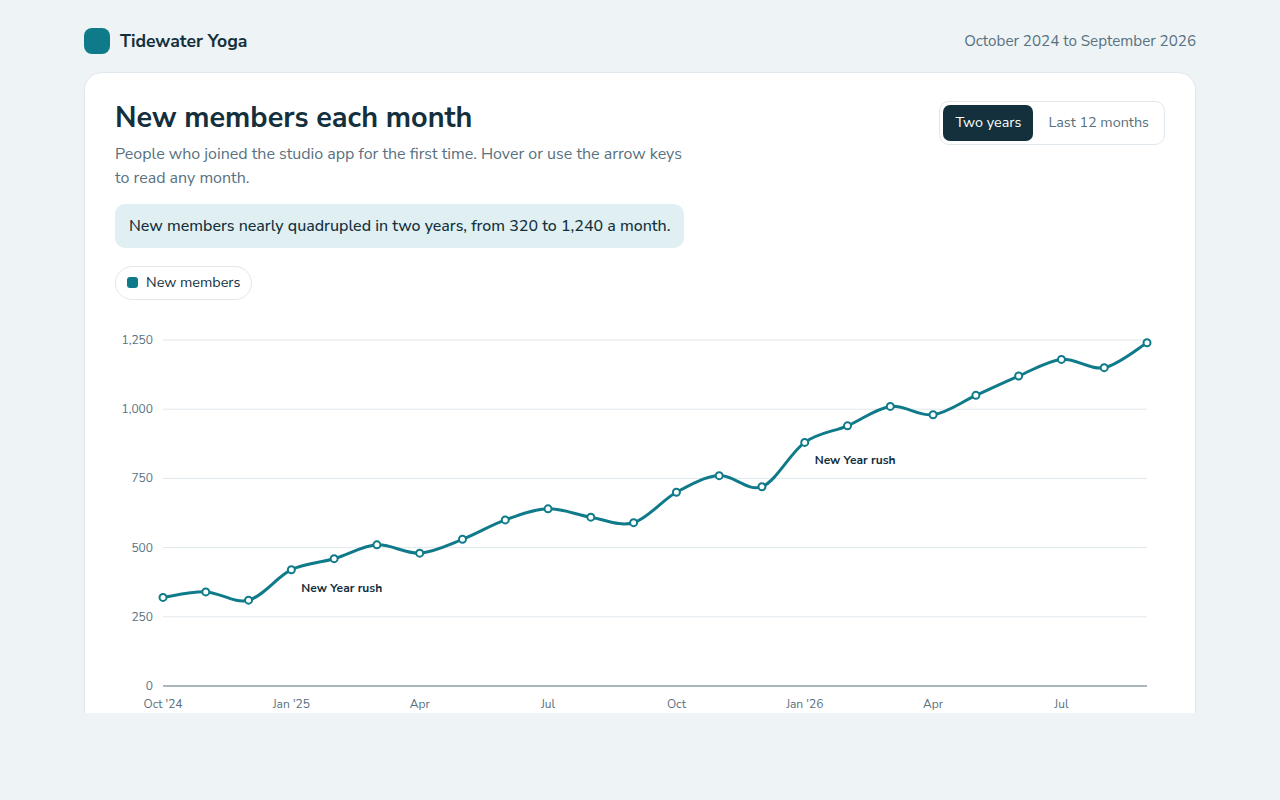
011. Line Chart
Example: new members each month for a yoga studio app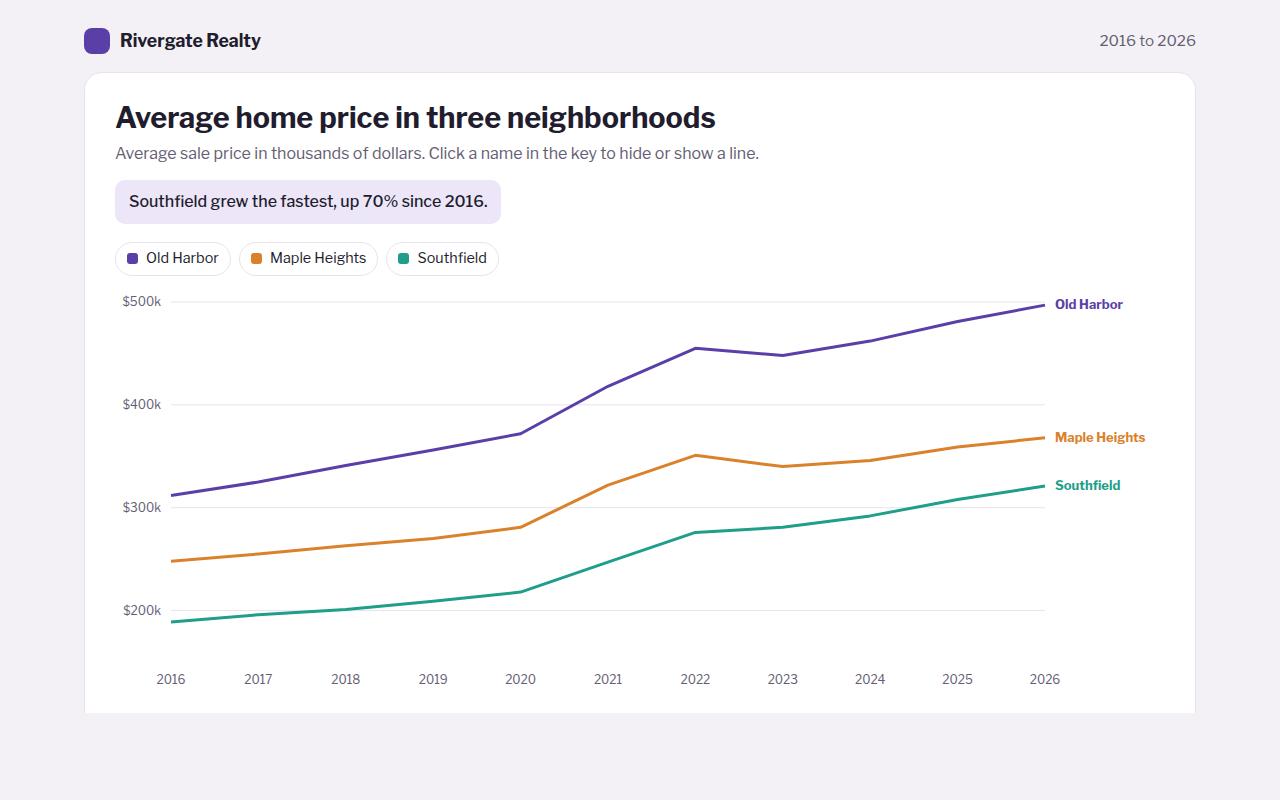
012. Multi Line Chart
Example: average home prices in three neighborhoods over ten years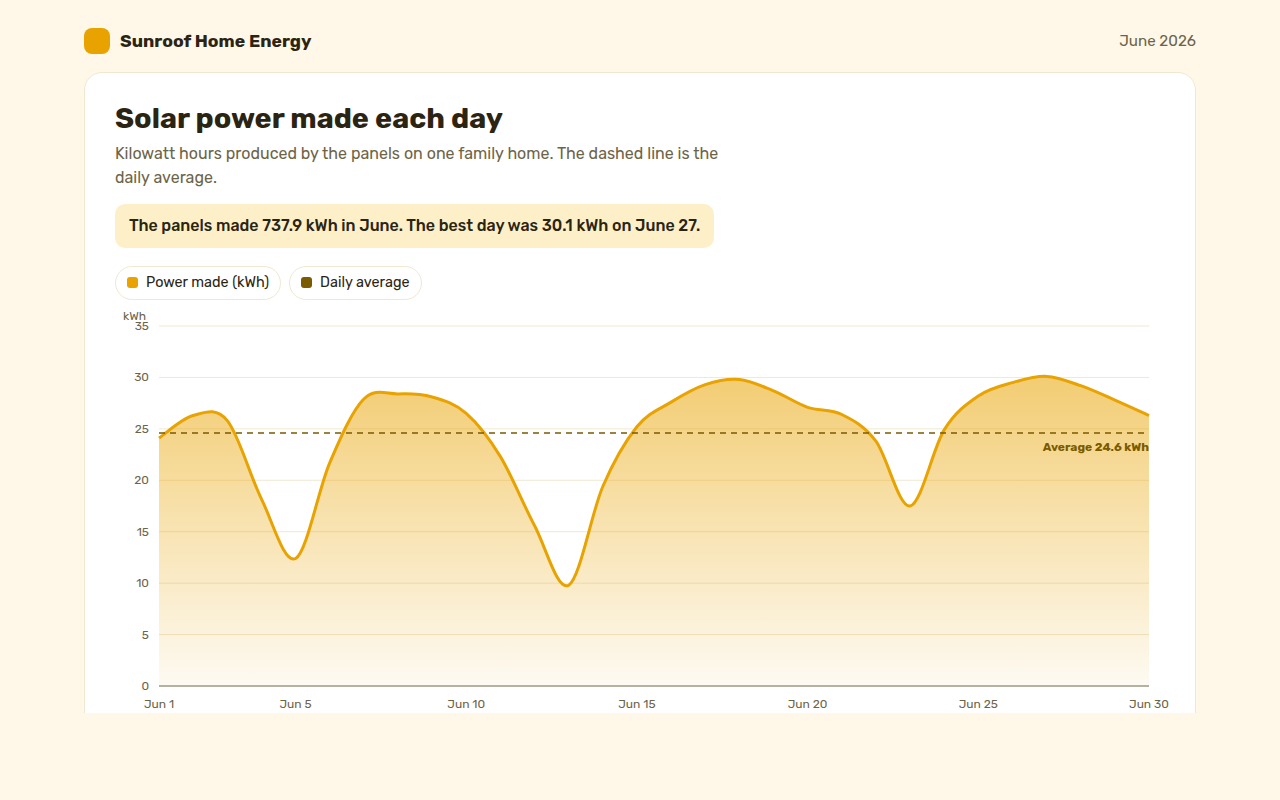
013. Area Chart
Example: solar power made each day by a family home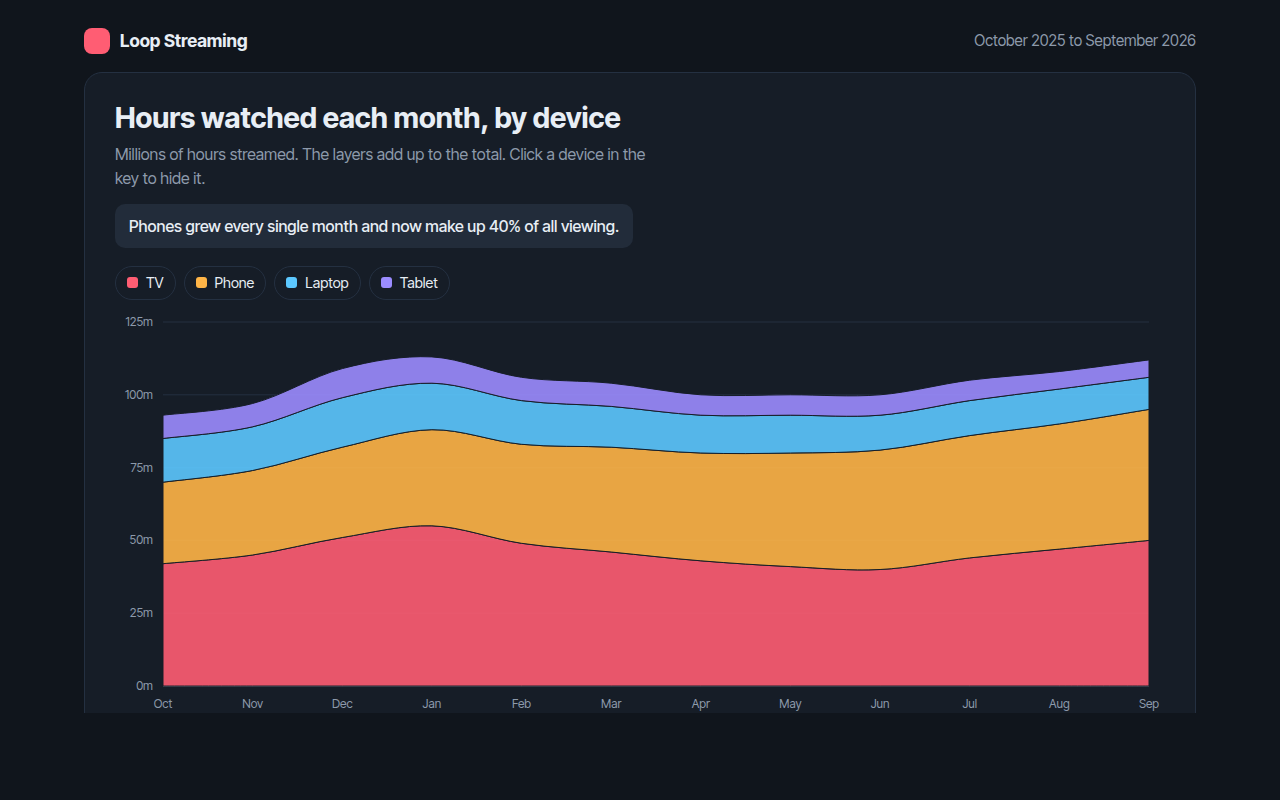
014. Stacked Area Chart
Example: hours watched each month on a streaming app, by device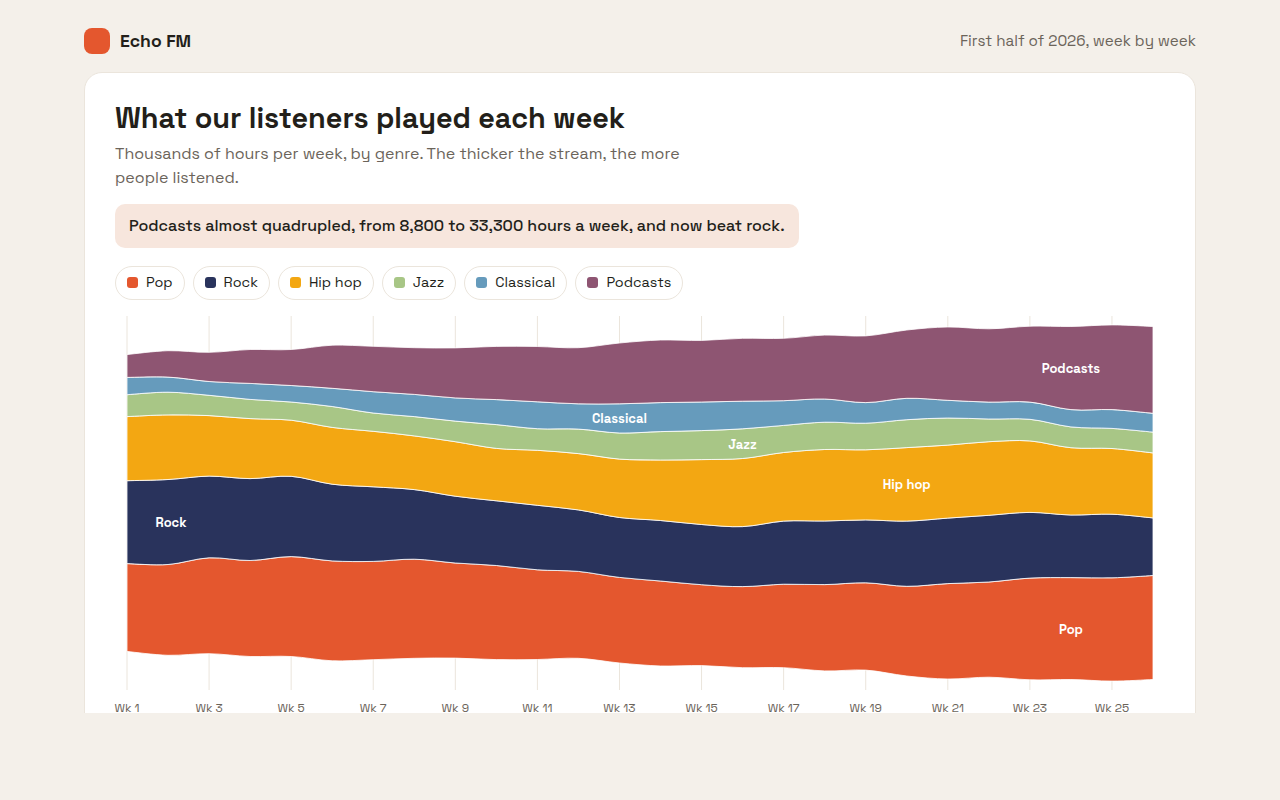
015. Streamgraph
Example: weekly listening hours by genre on a radio app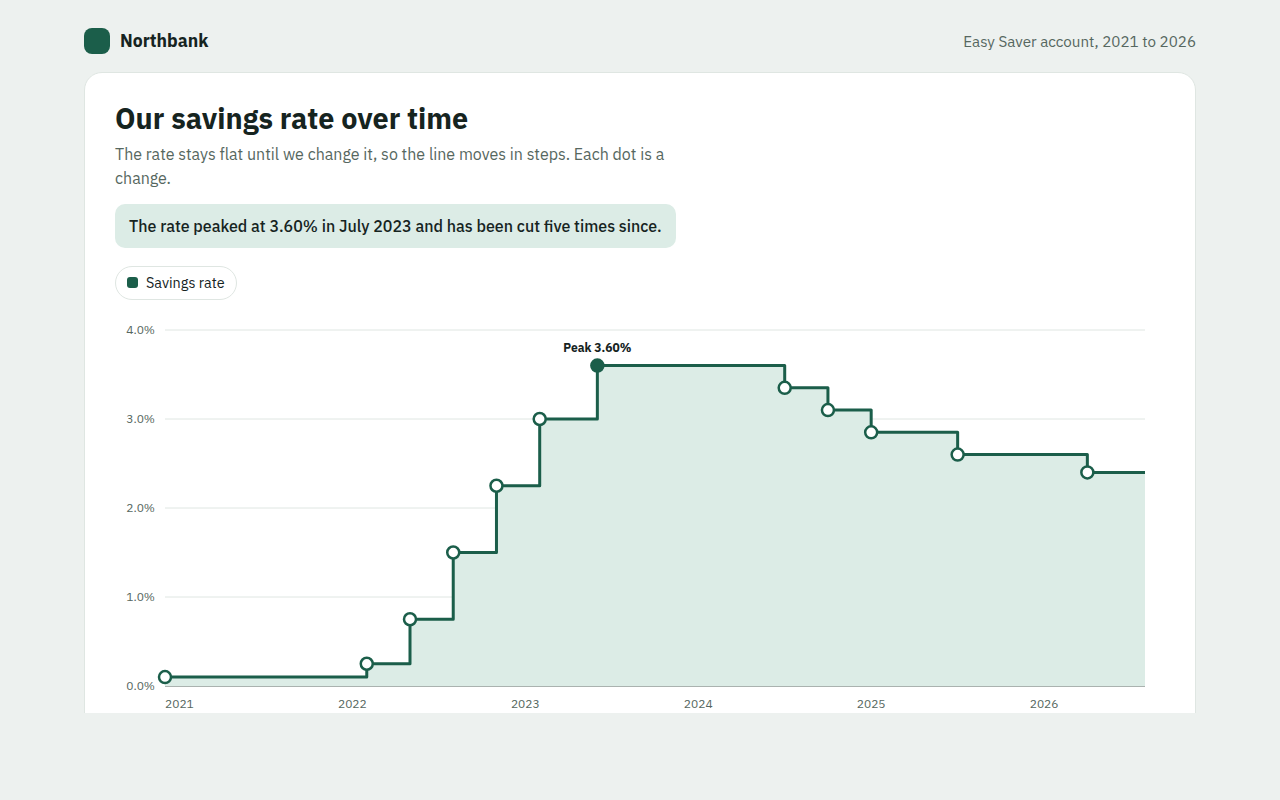
016. Step Line Chart
Example: the interest rate on a savings account from 2021 to 2026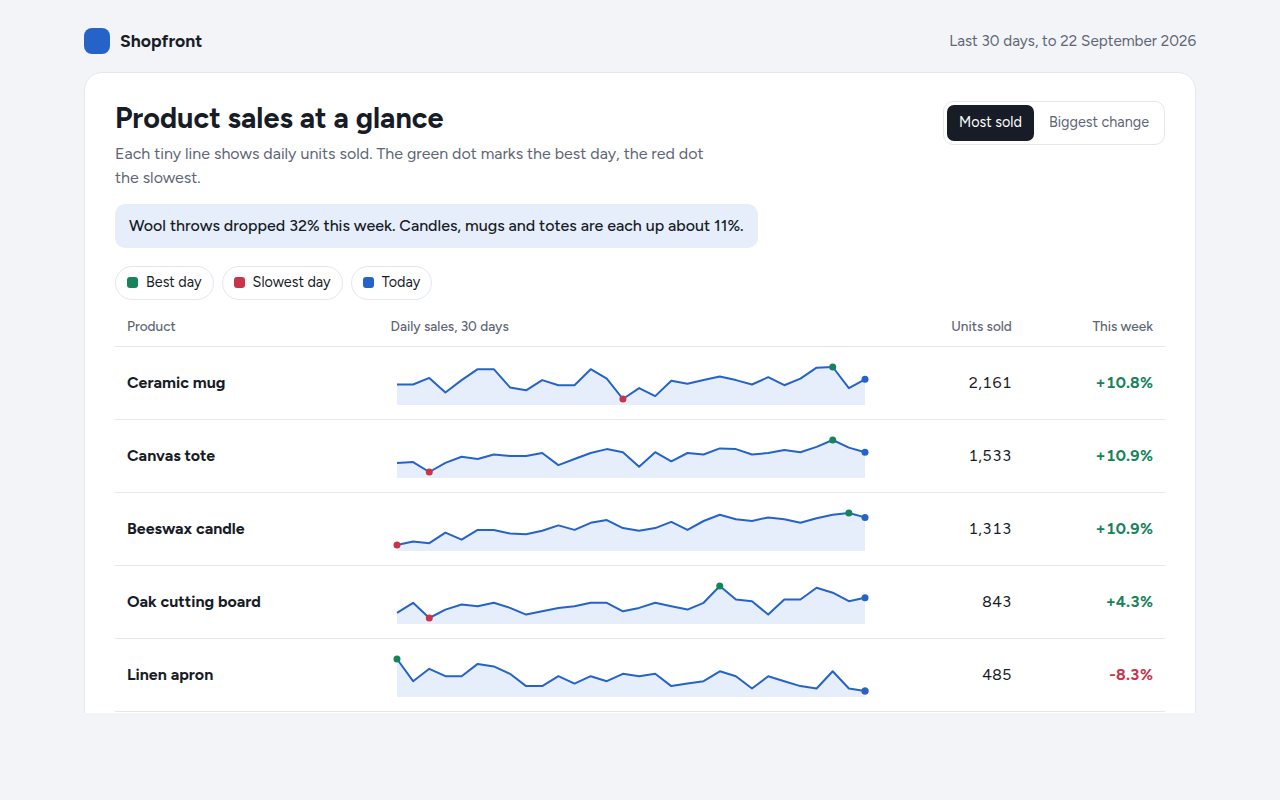
017. Sparkline
Example: daily sales for six products in a shop dashboard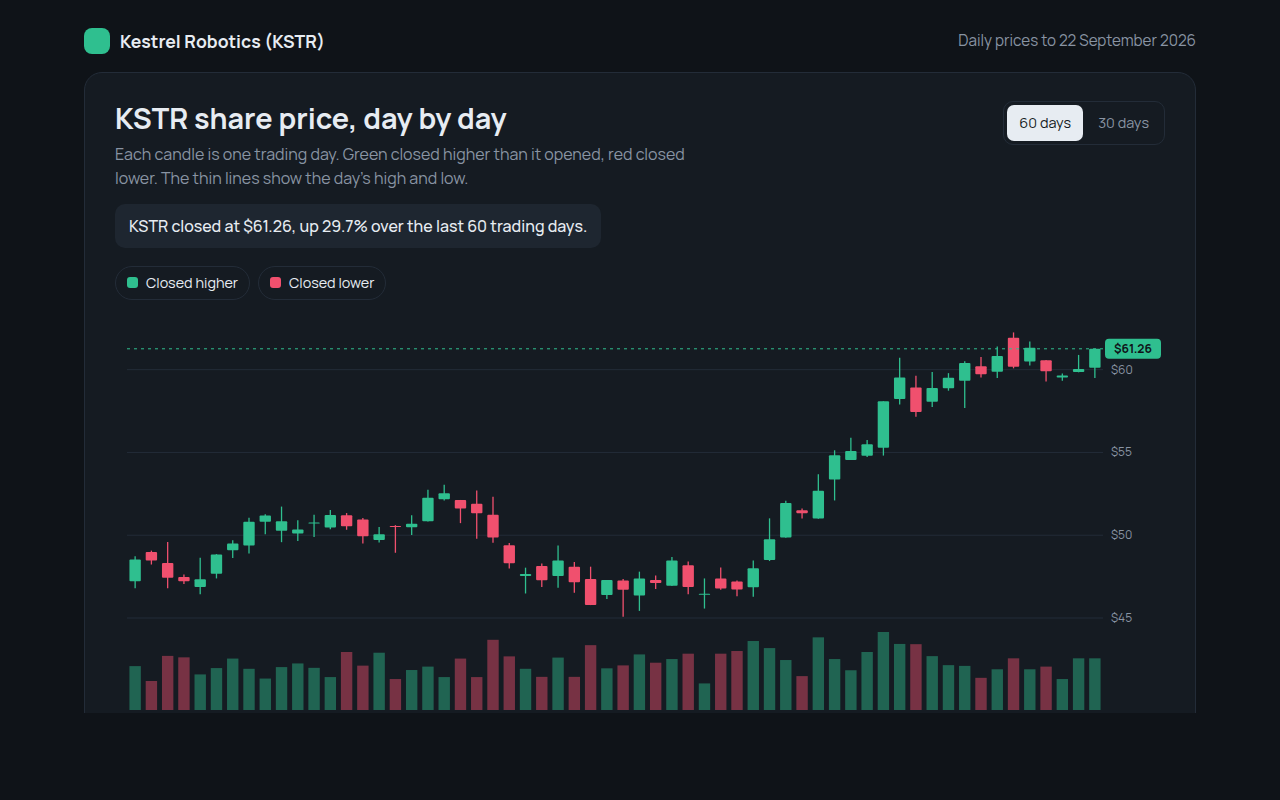
018. Candlestick Chart
Example: daily share prices and volume for a made up robotics company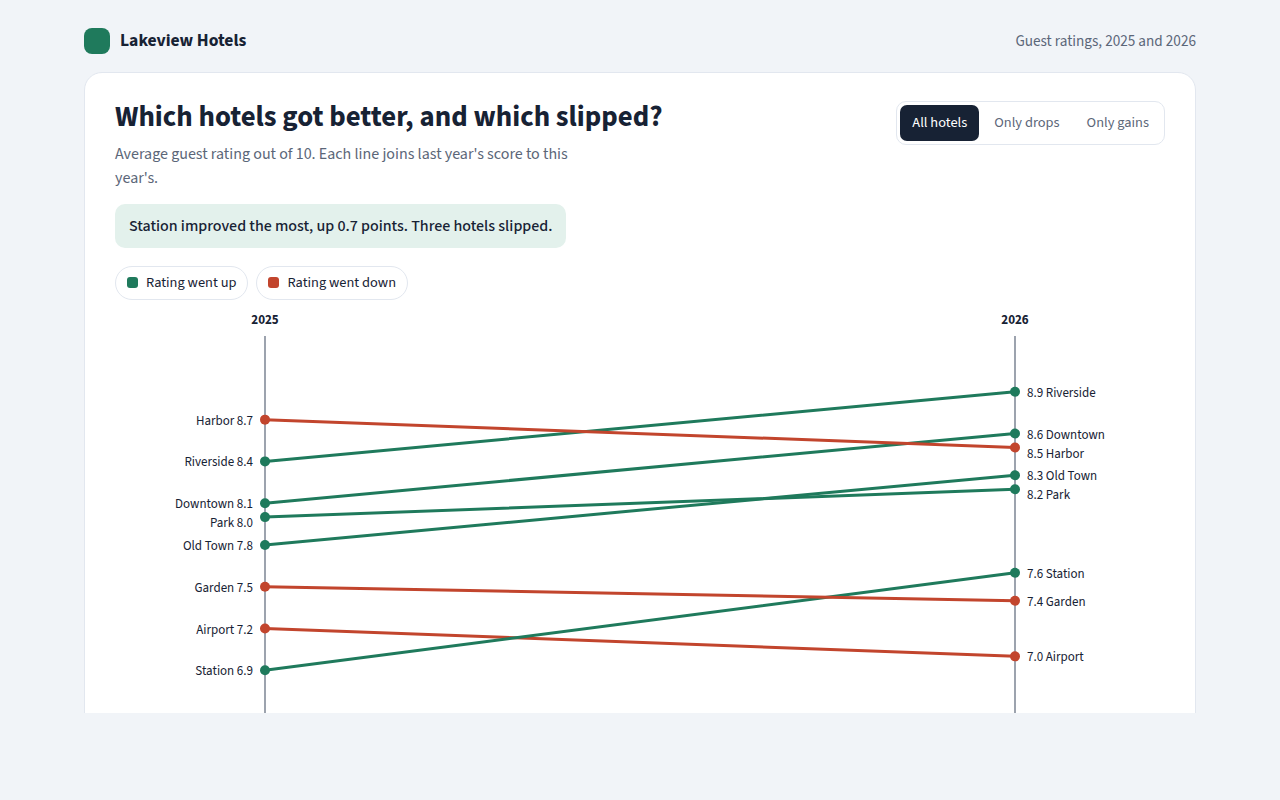
019. Slope Chart
Example: guest ratings for eight hotels in 2025 and 2026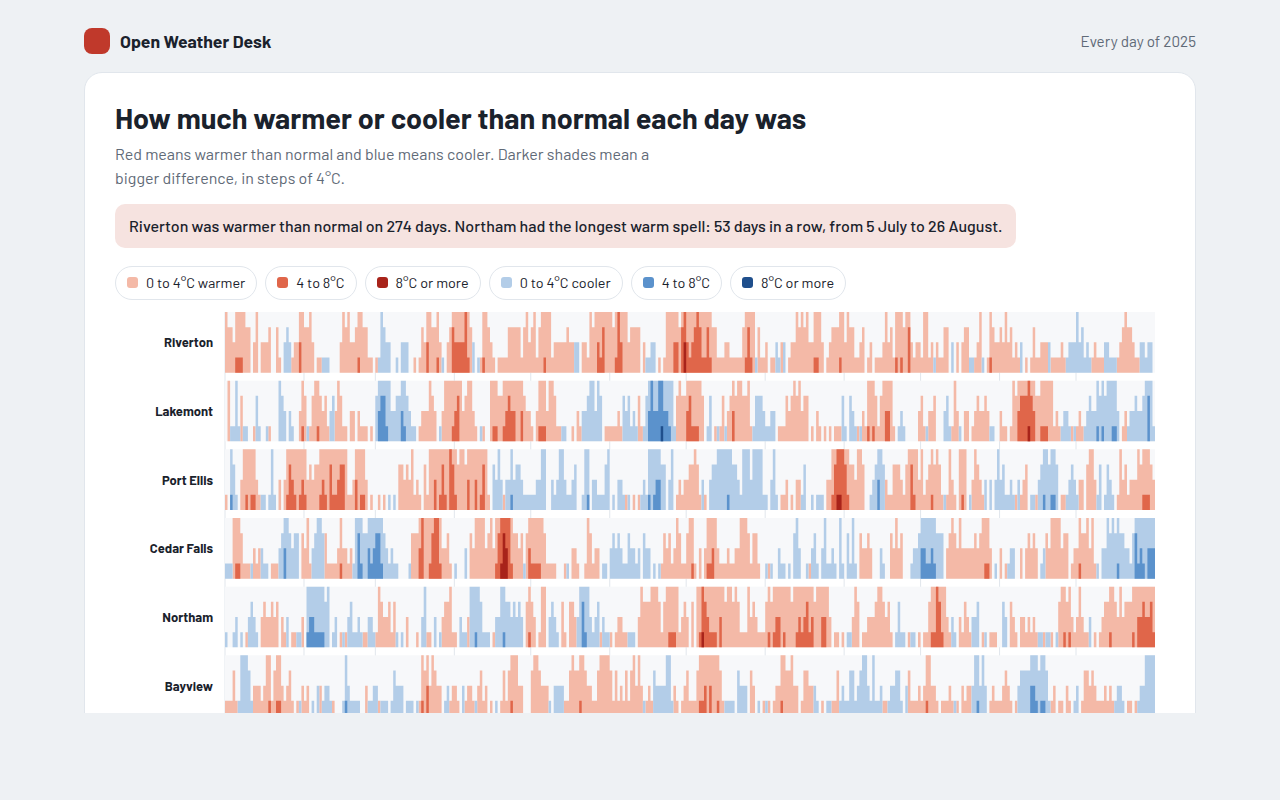
020. Horizon Chart
Example: daily temperature above or below normal for six cities over a year3. Part to Whole
See all 10 part to whole
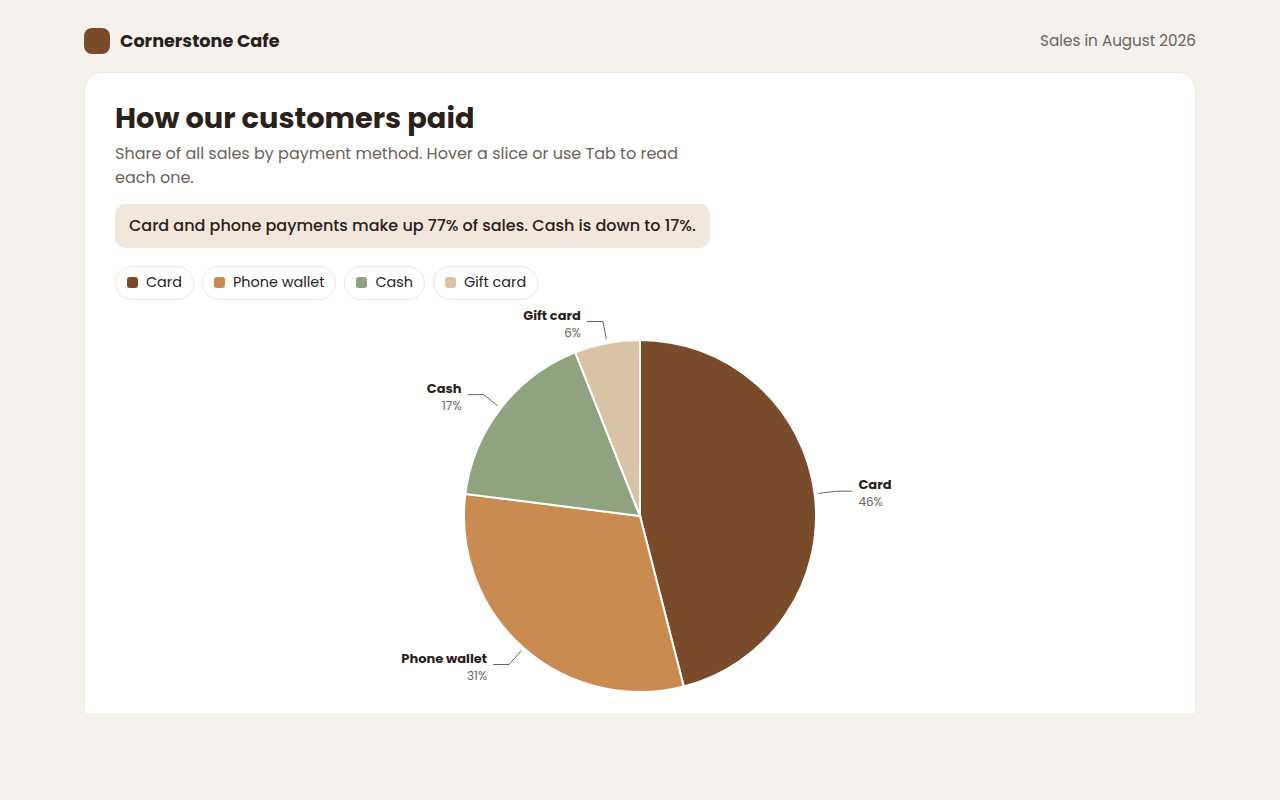
021. Pie Chart
Example: how customers paid at a cafe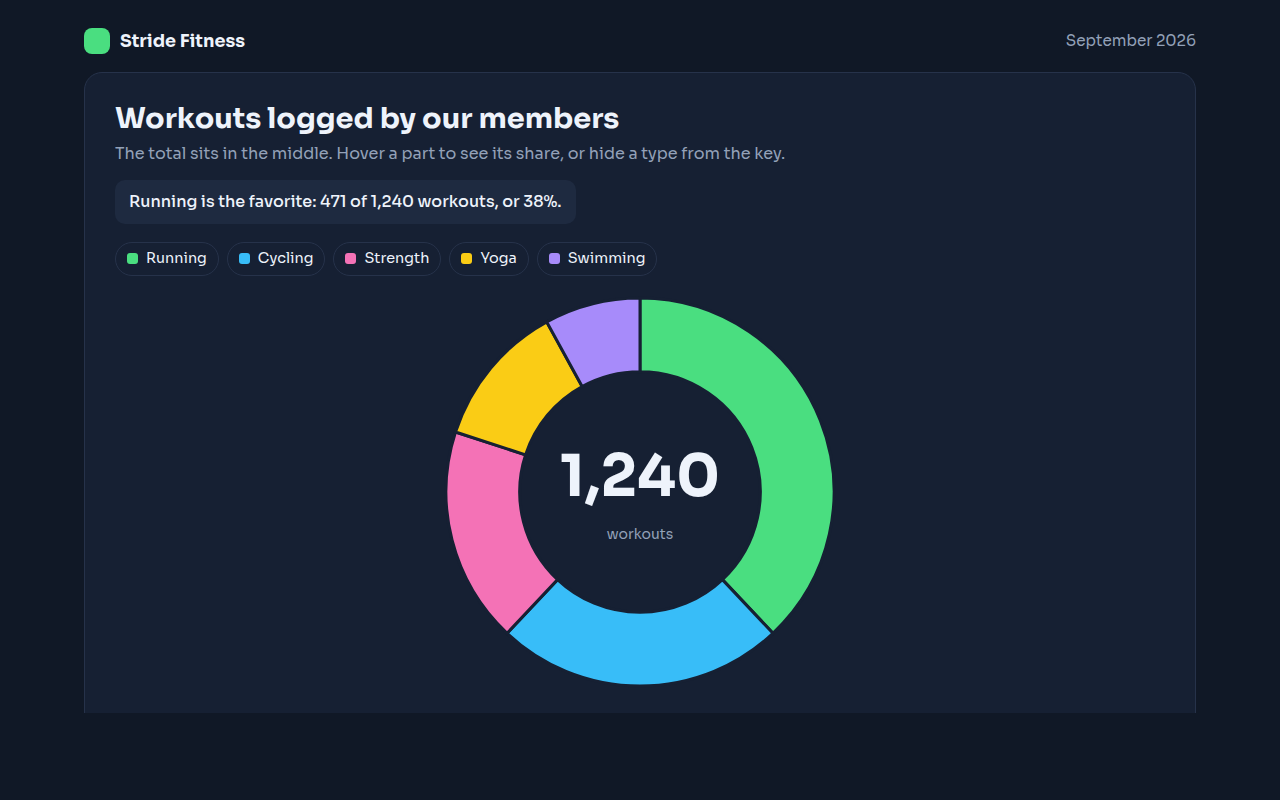
022. Donut Chart
Example: workouts logged by members of a fitness app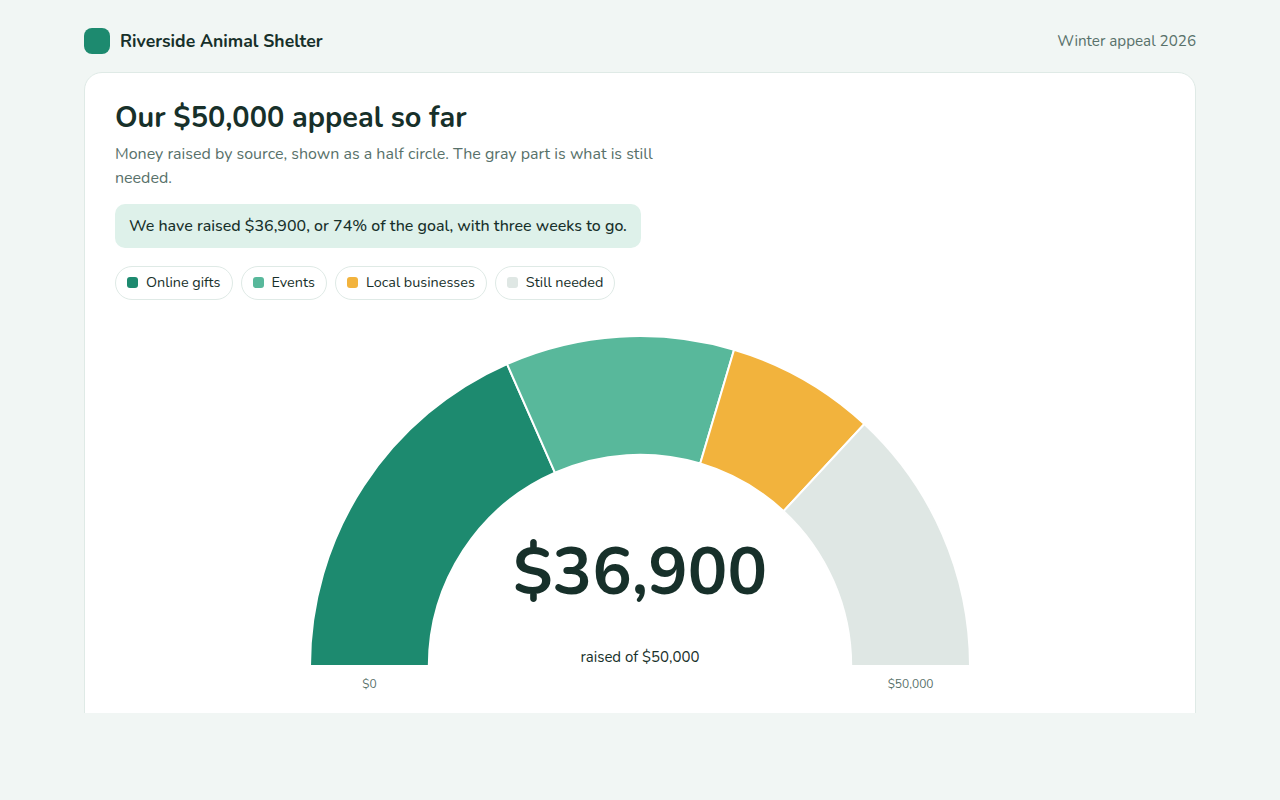
023. Semi Donut Chart
Example: a fundraising appeal and the money still needed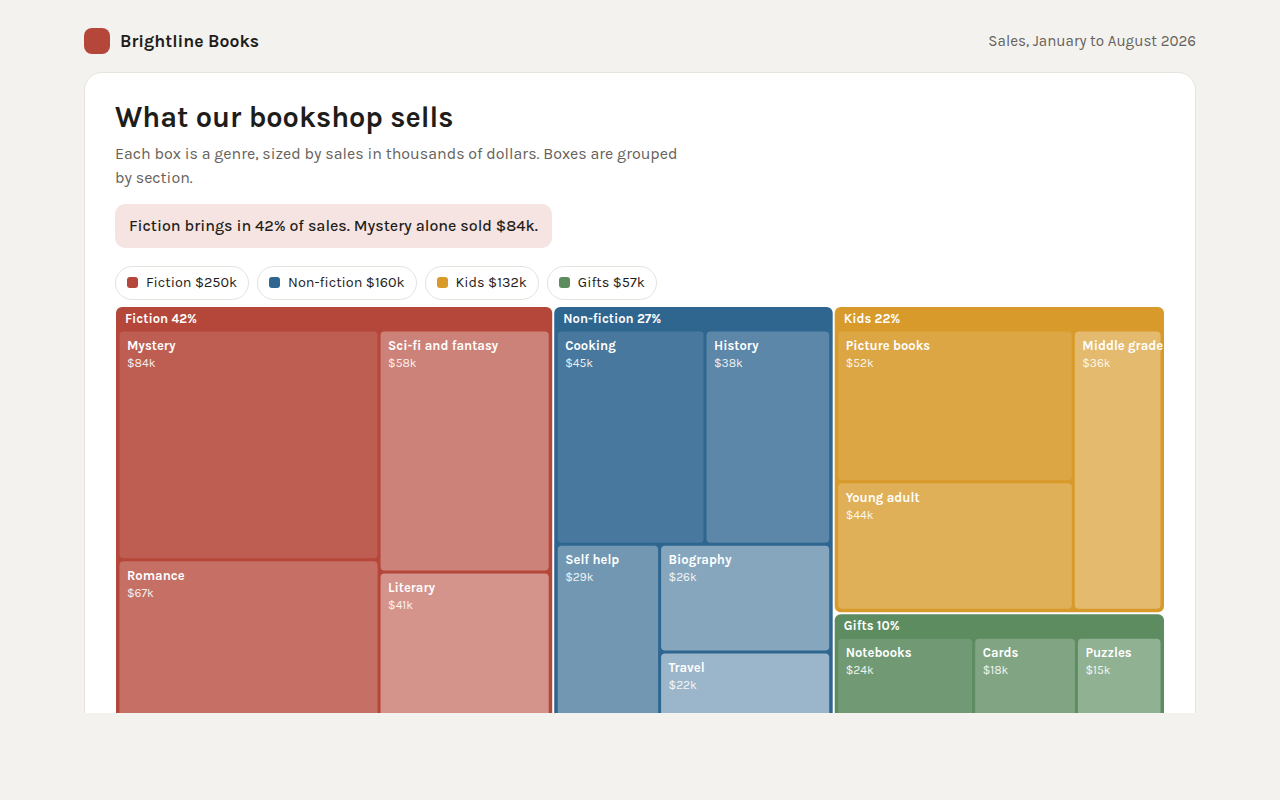
024. Treemap
Example: bookshop sales by section and genre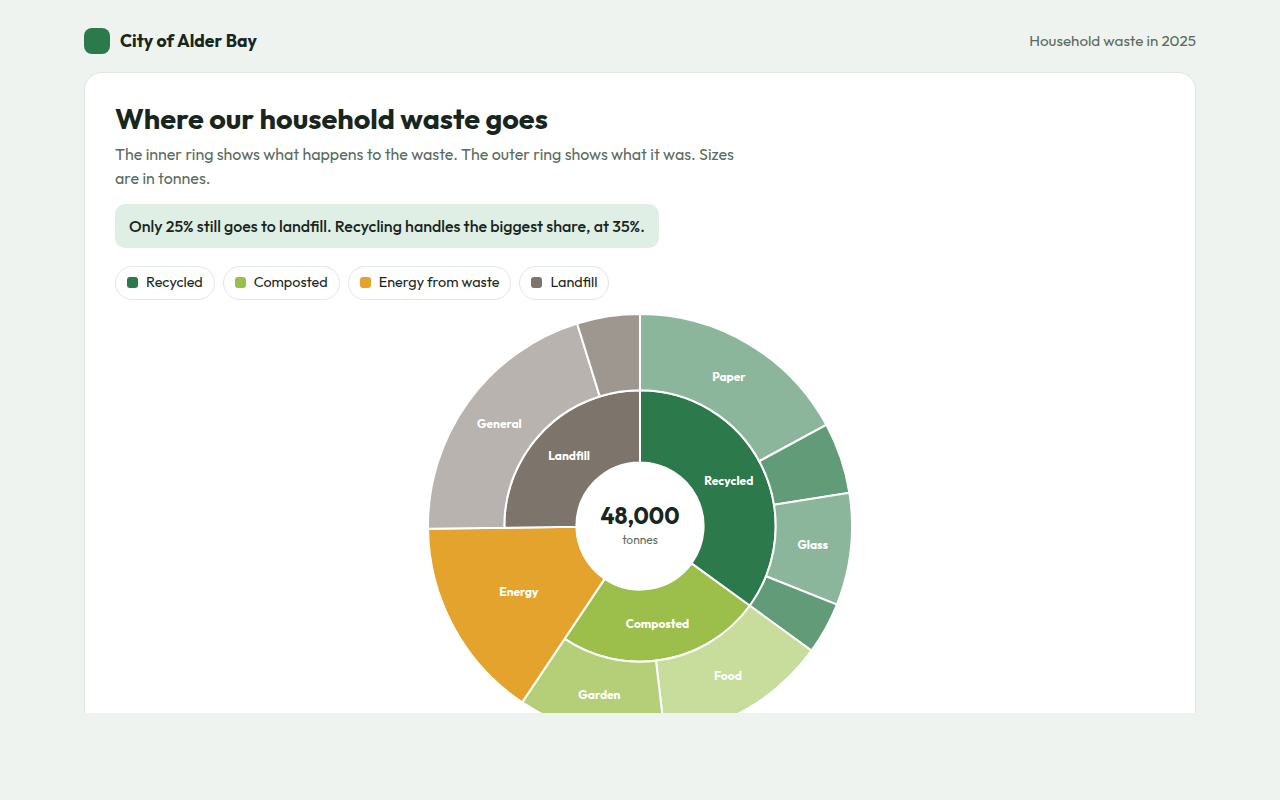
025. Sunburst Chart
Example: where a city sends its household waste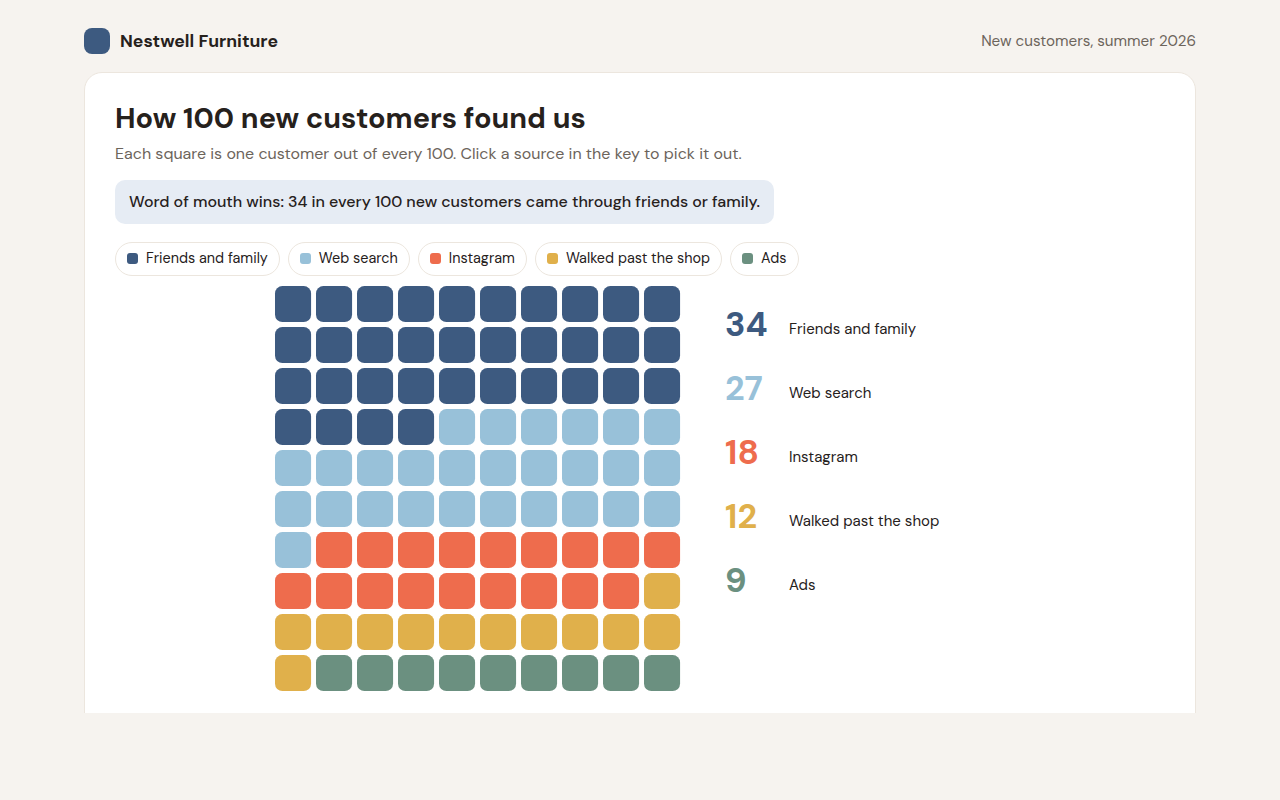
026. Waffle Chart
Example: how 100 new customers found a furniture shop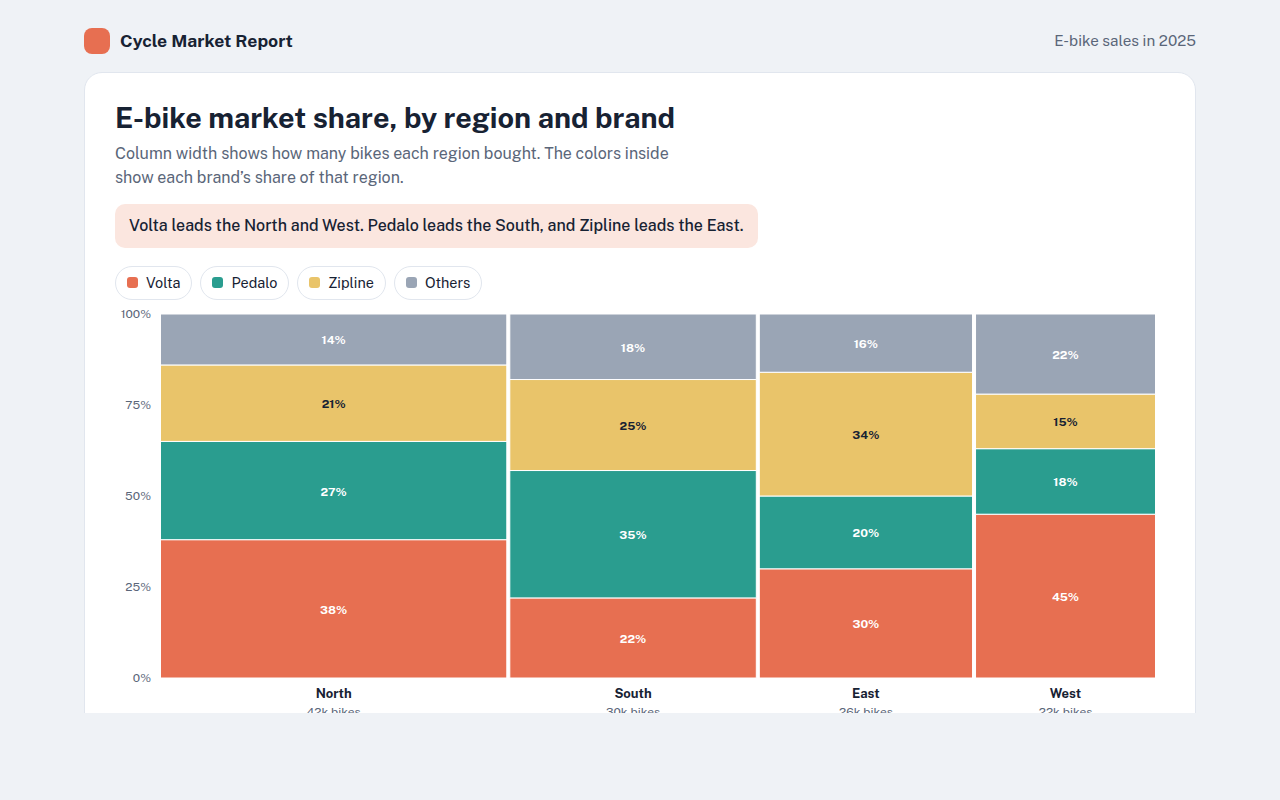
027. Marimekko Chart
Example: e-bike market share by region and brand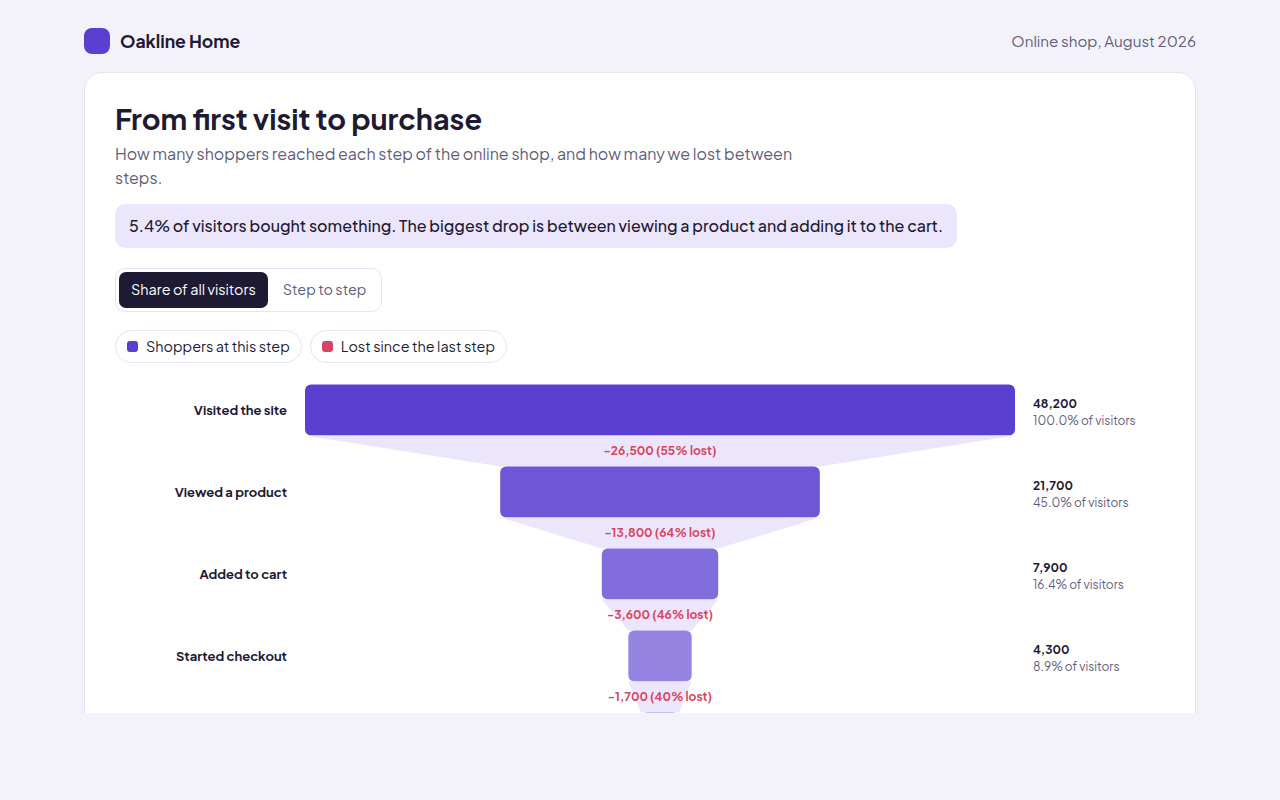
028. Funnel Chart
Example: shoppers moving from first visit to purchase in an online shop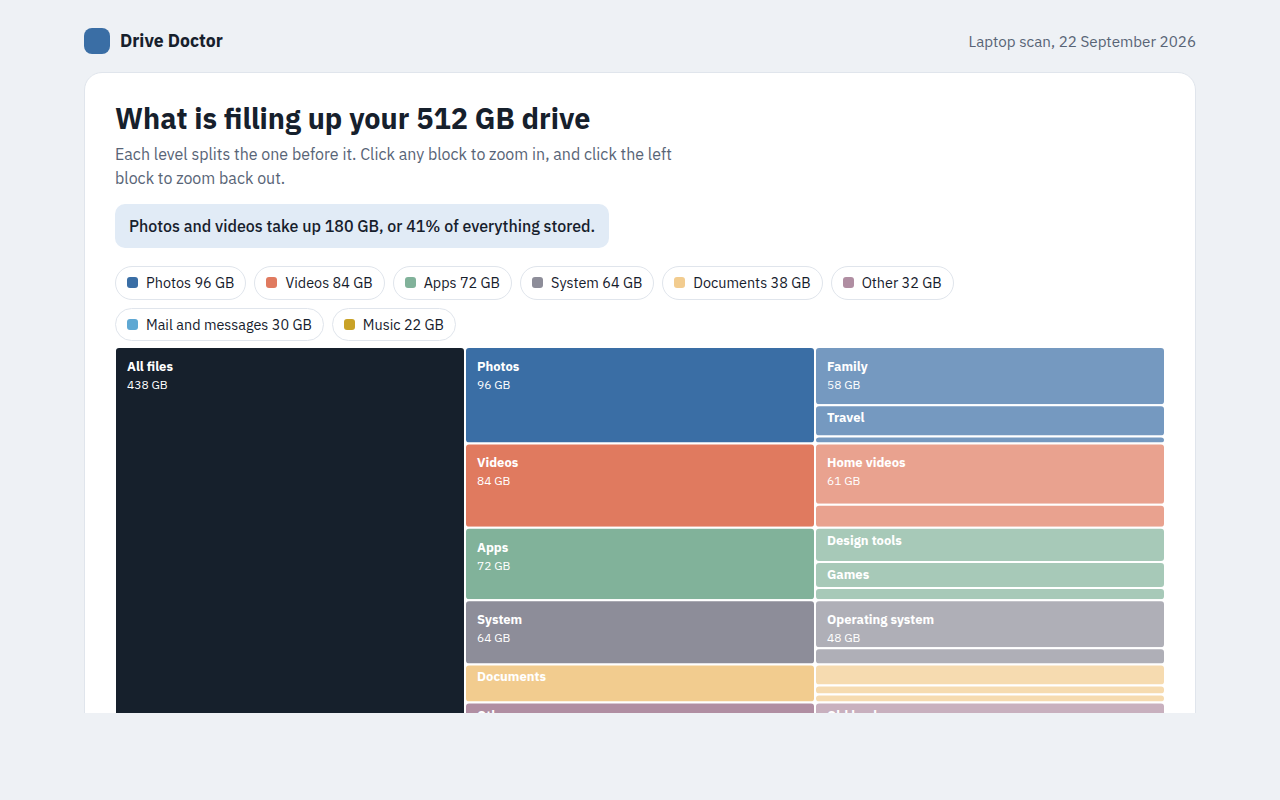
029. Icicle Chart
Example: what is filling up a laptop drive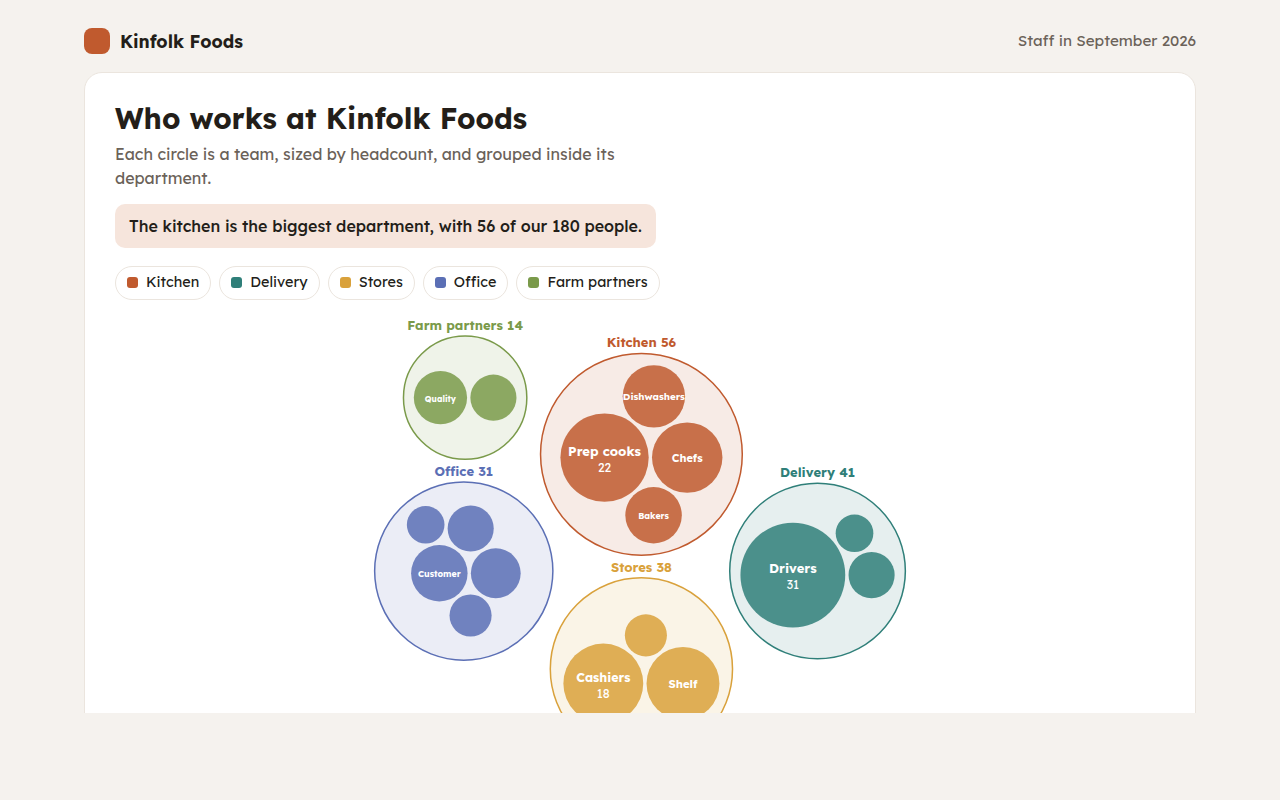
030. Circle Packing Chart
Example: staff at a food company grouped by department and team4. Distribution
See all 10 distribution
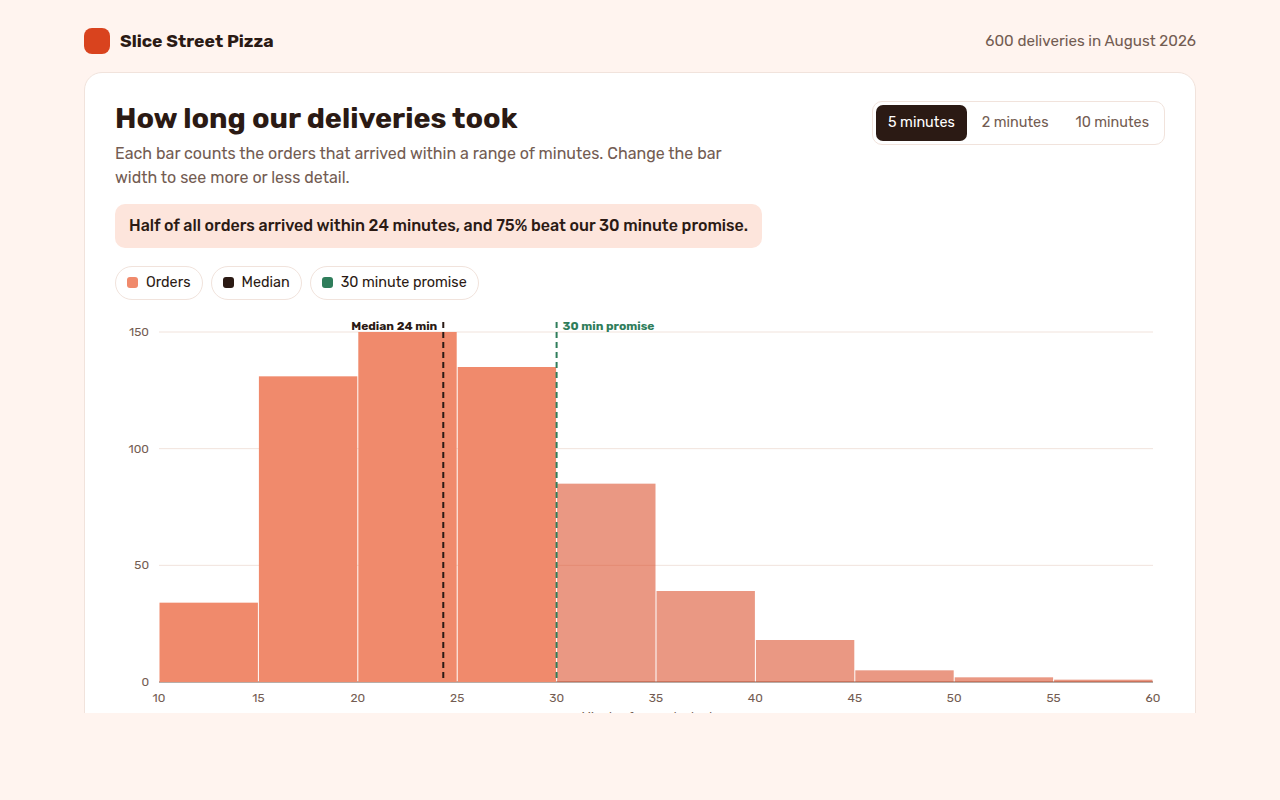
031. Histogram
Example: delivery times for 600 pizza orders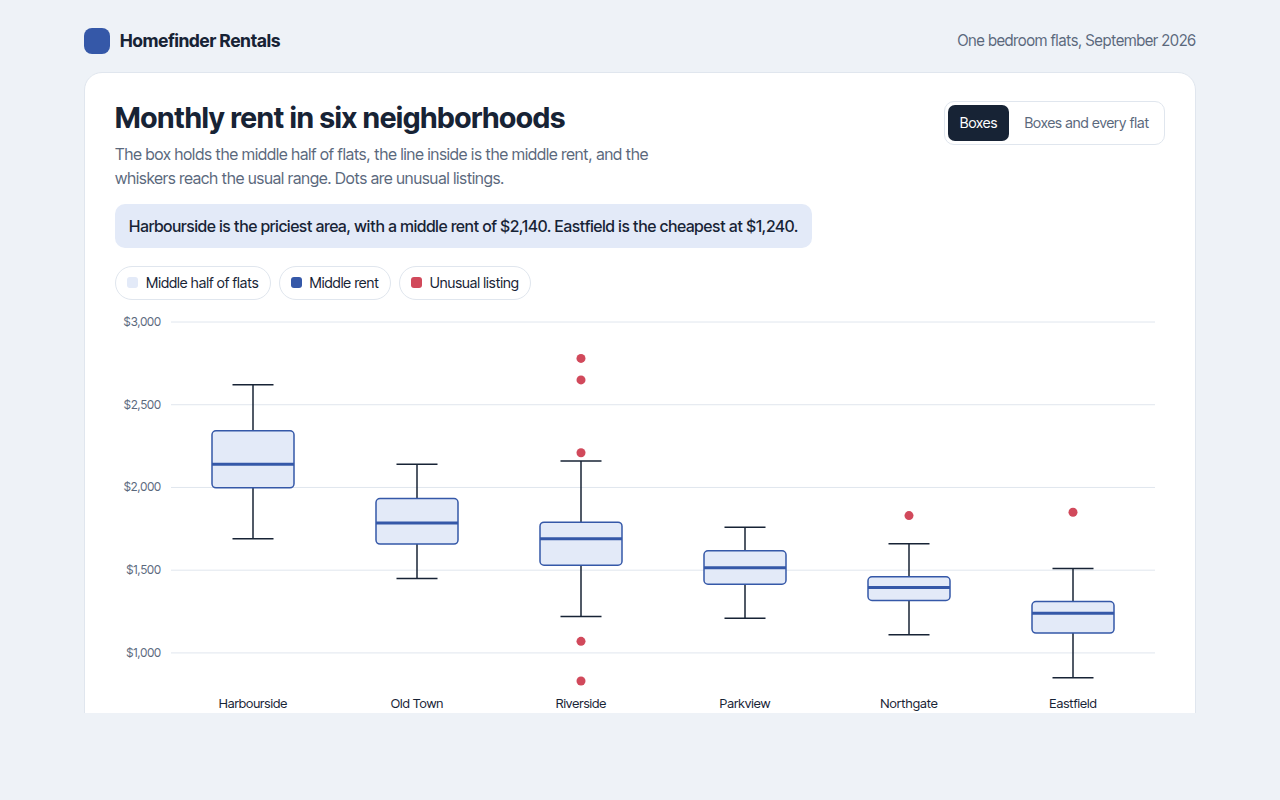
032. Box Plot
Example: monthly rent for flats in six neighborhoods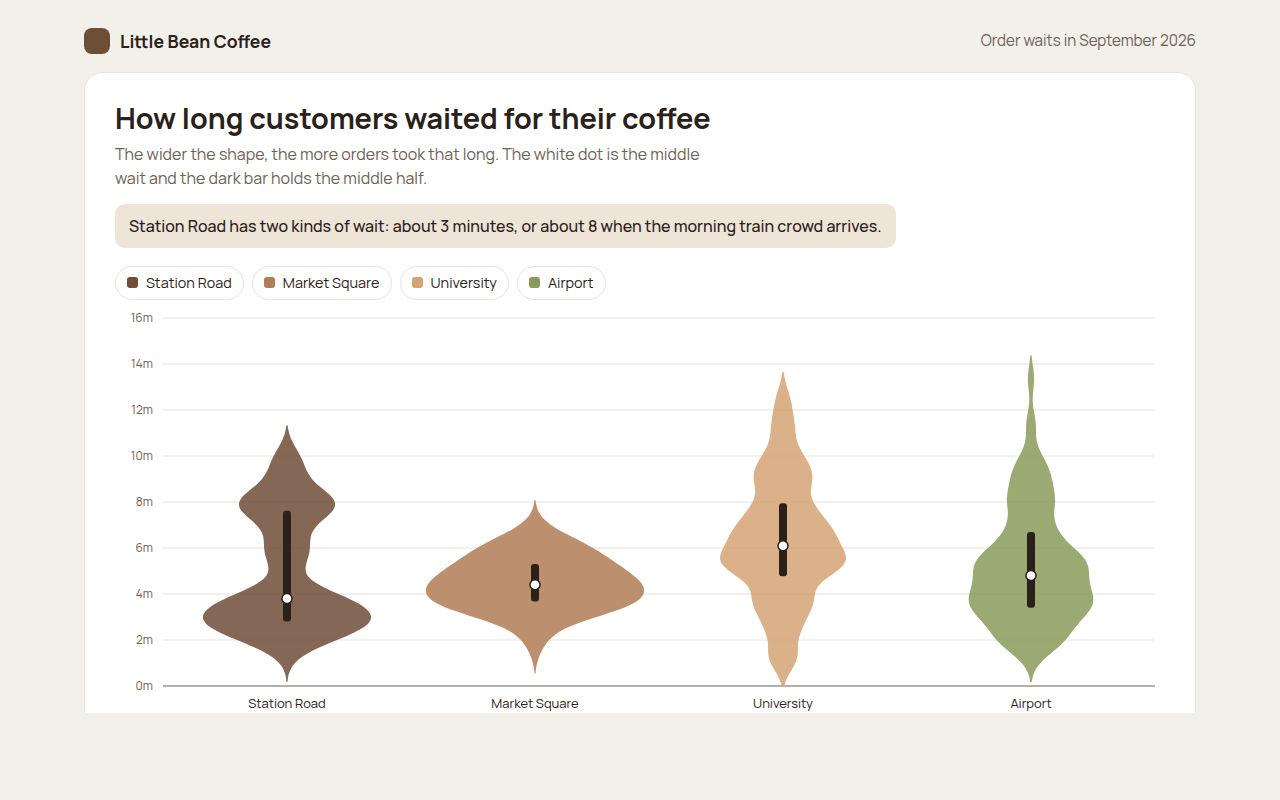
033. Violin Plot
Example: coffee order waits at four cafes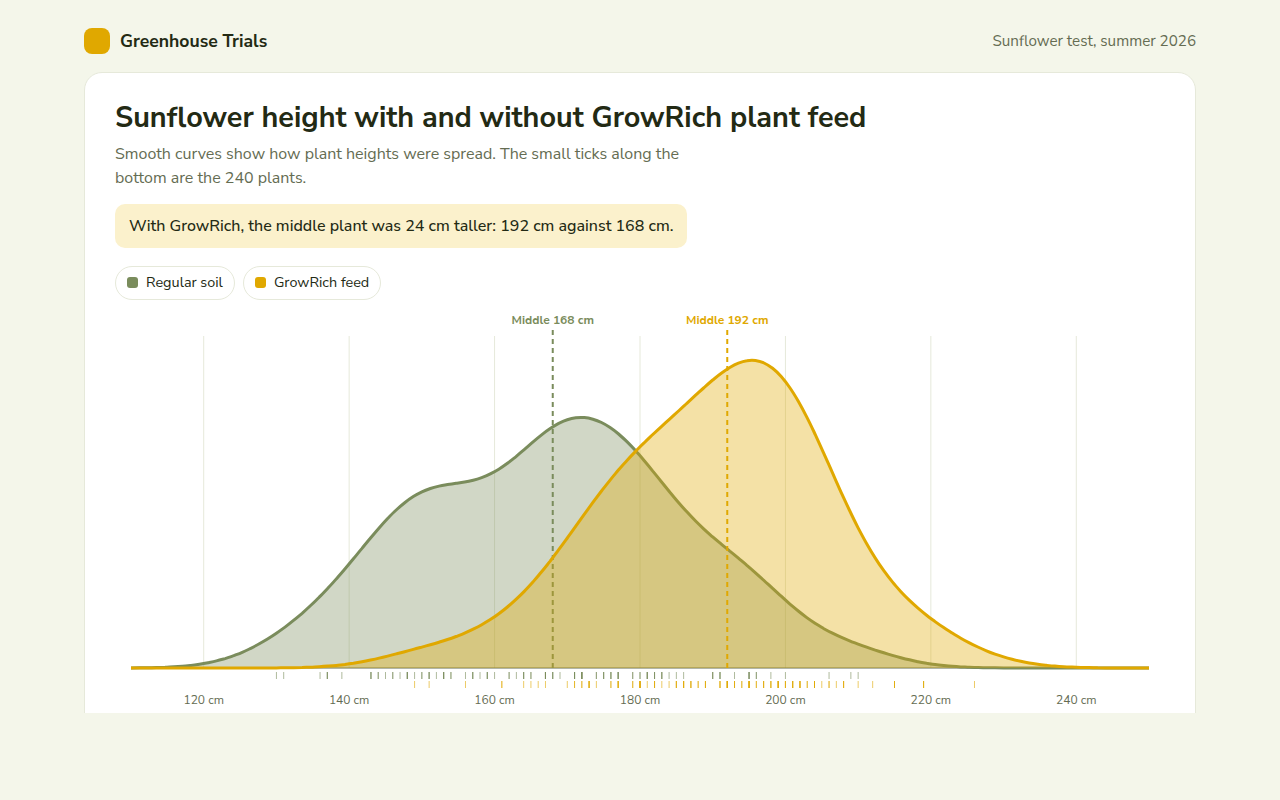
034. Density Plot
Example: sunflower heights with and without plant feed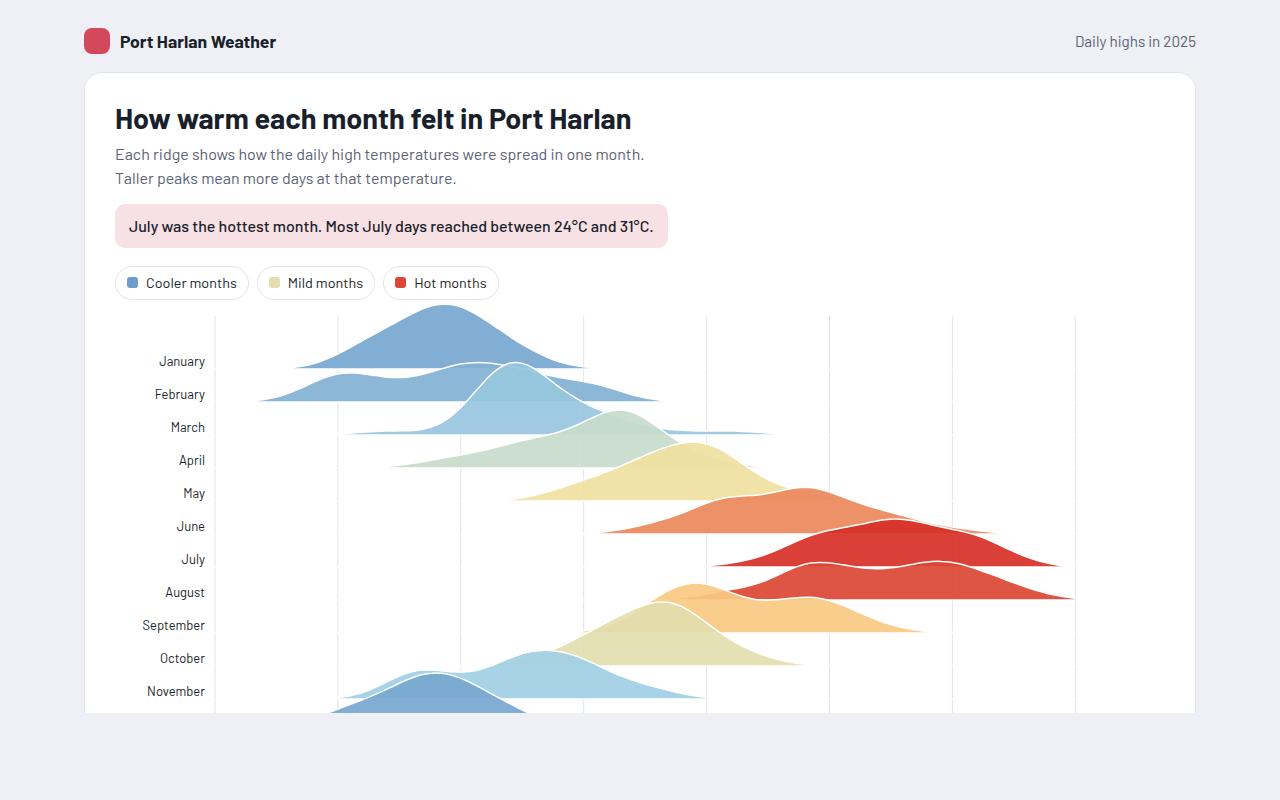
035. Ridgeline Plot
Example: daily high temperatures for each month of the year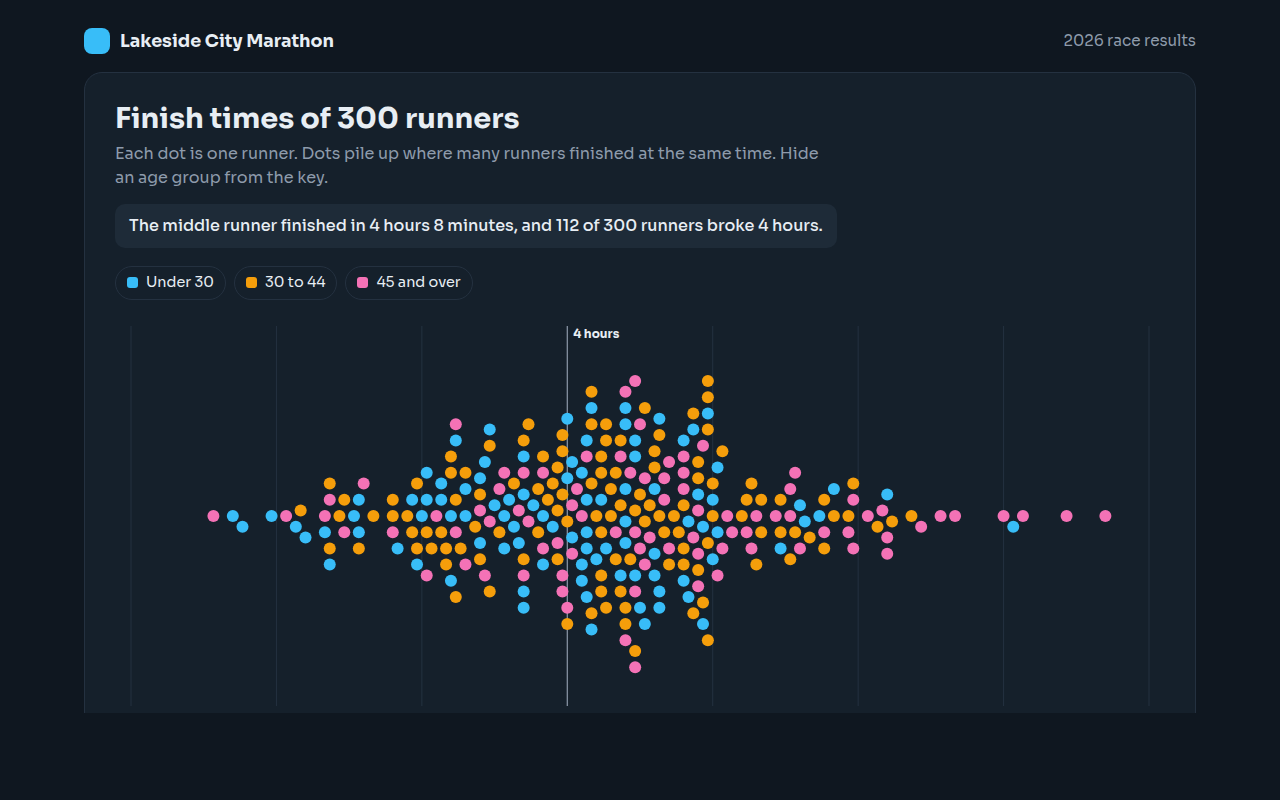
036. Beeswarm Plot
Example: finish times for 300 marathon runners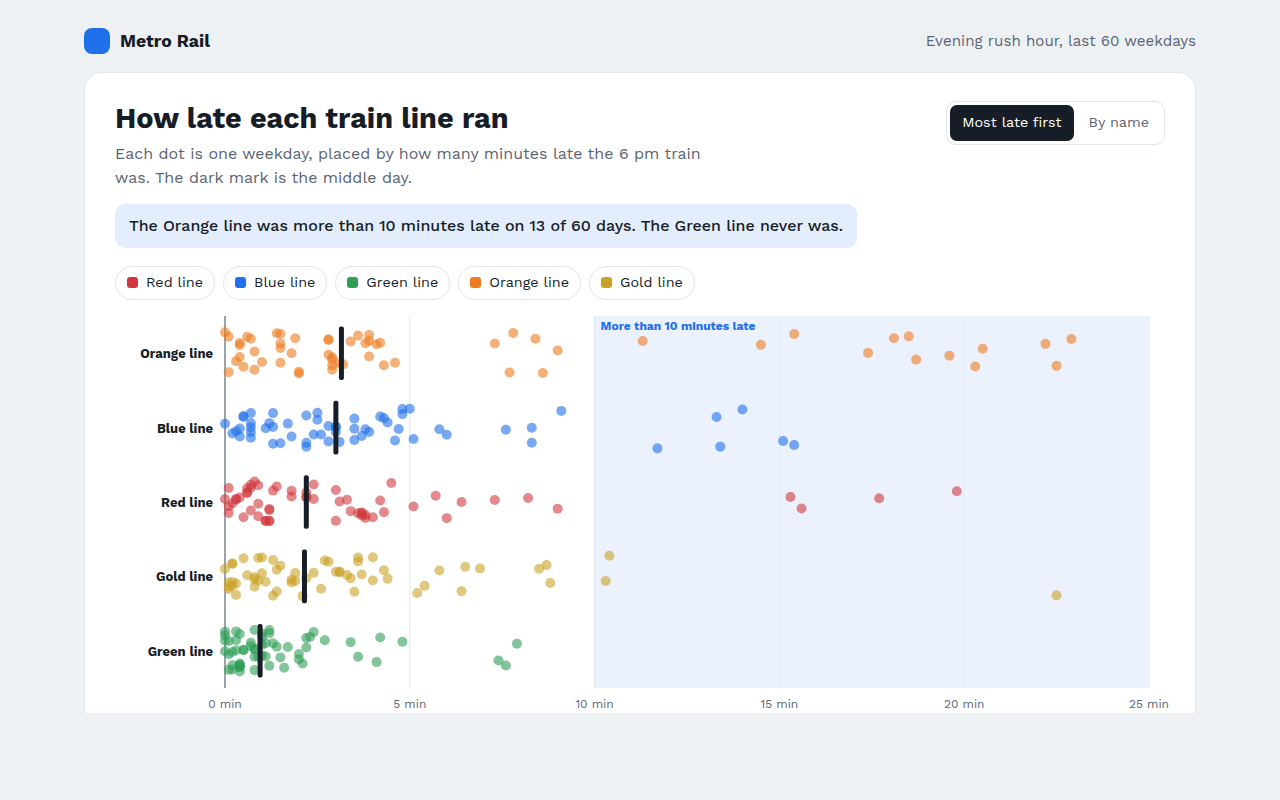
037. Strip Plot
Example: train delays on five lines over 60 weekdays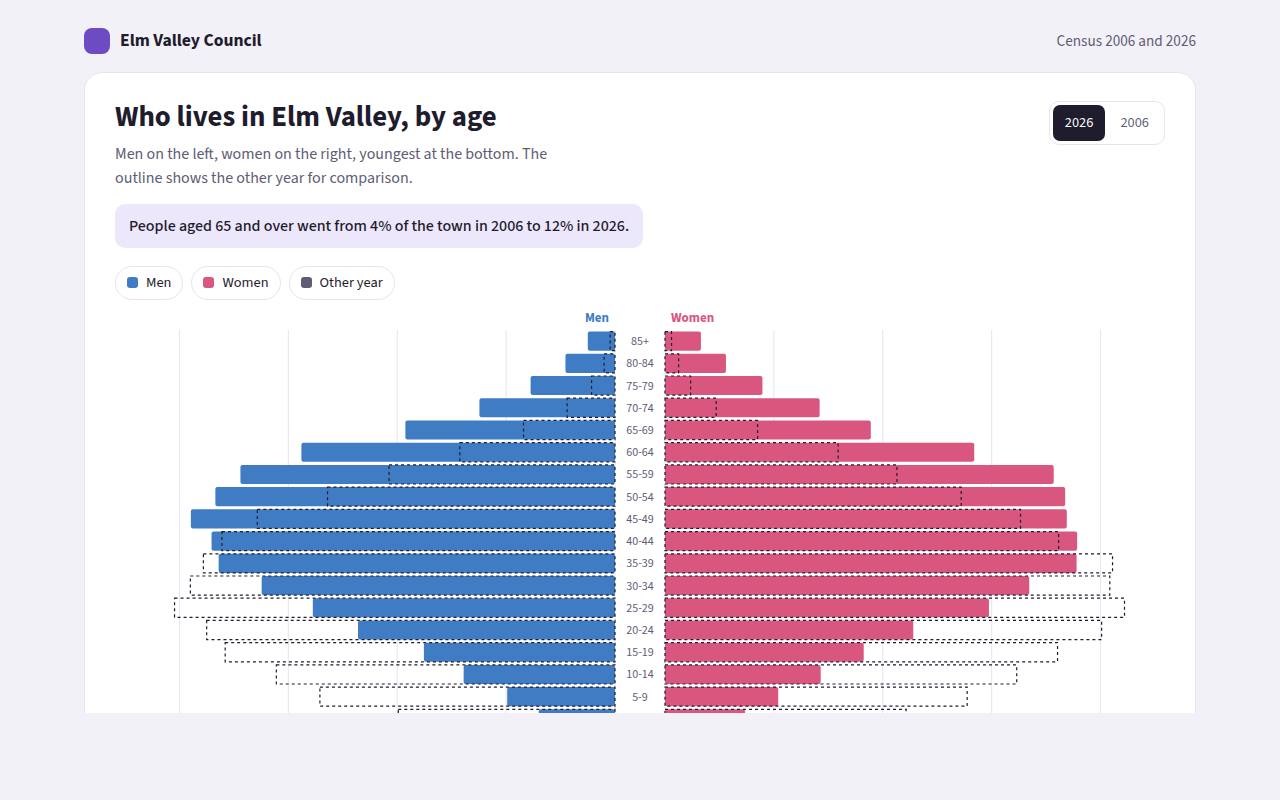
038. Population Pyramid
Example: the age of a town in 2006 and 2026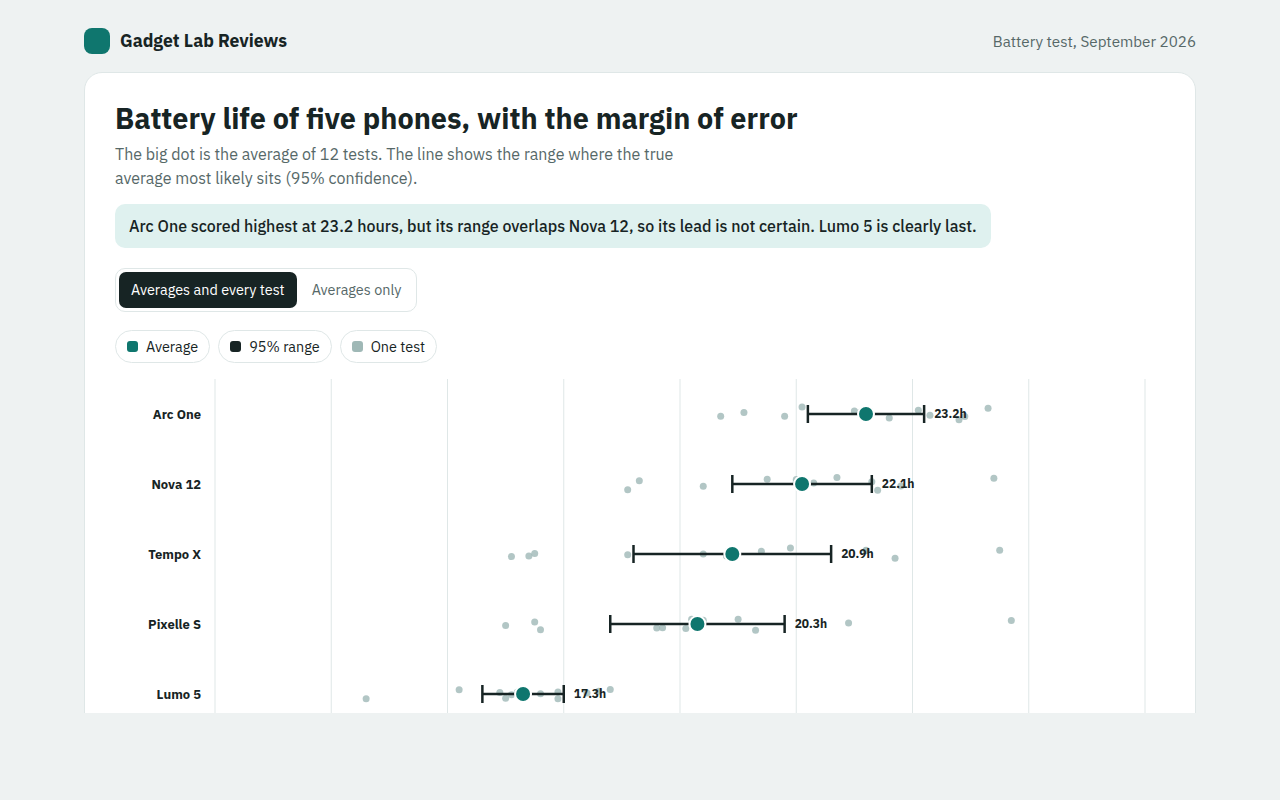
039. Error Bar Chart
Example: battery life test results for five phones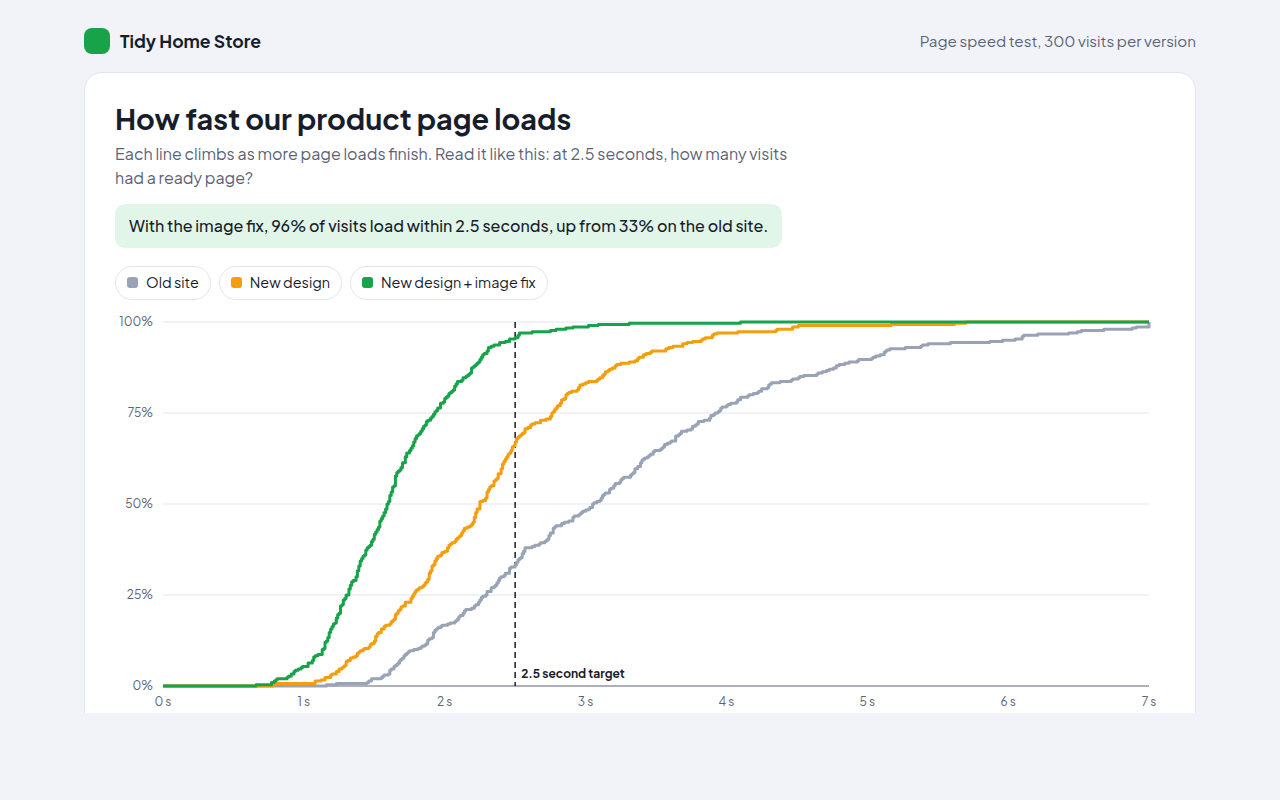
040. Cumulative Distribution Chart
Example: page load times for three versions of a website5. Relationships
See all 10 relationships
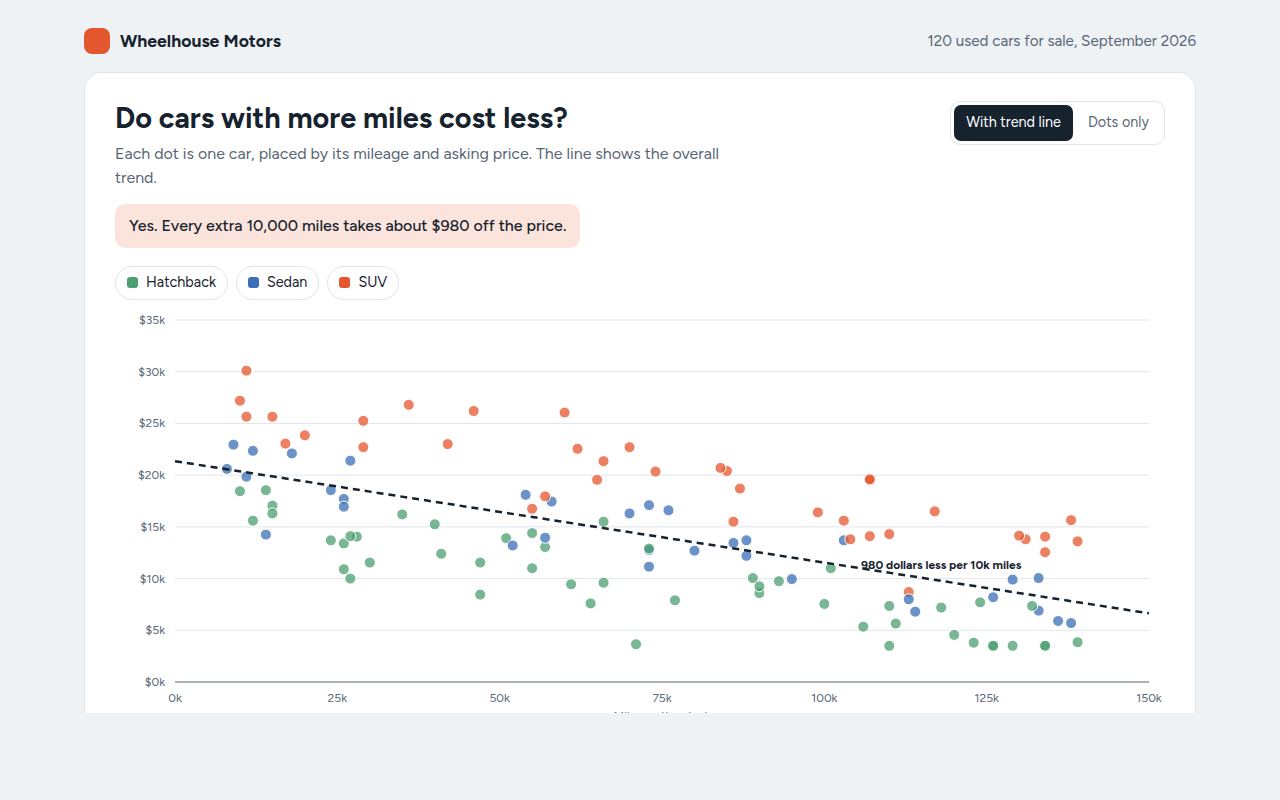
041. Scatter Plot
Example: used car prices against mileage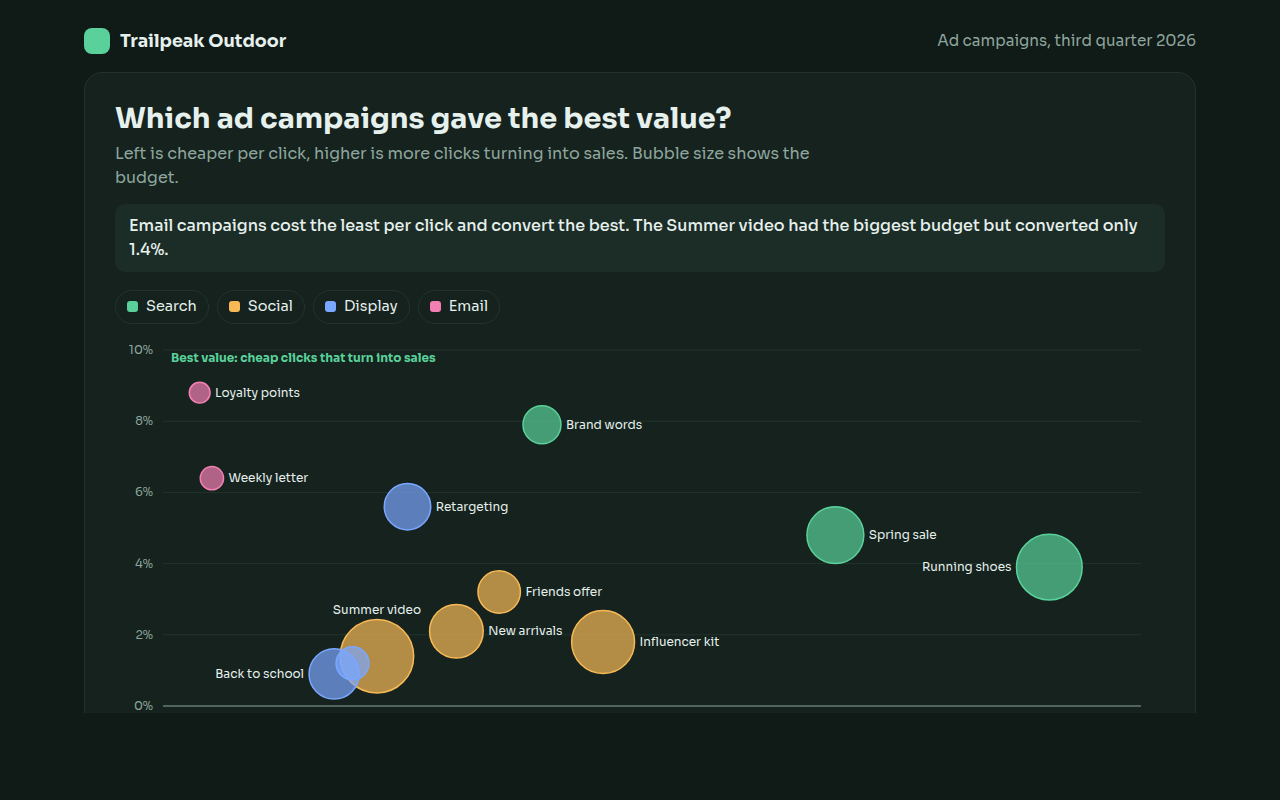
042. Bubble Chart
Example: ad campaigns compared on cost, conversion and budget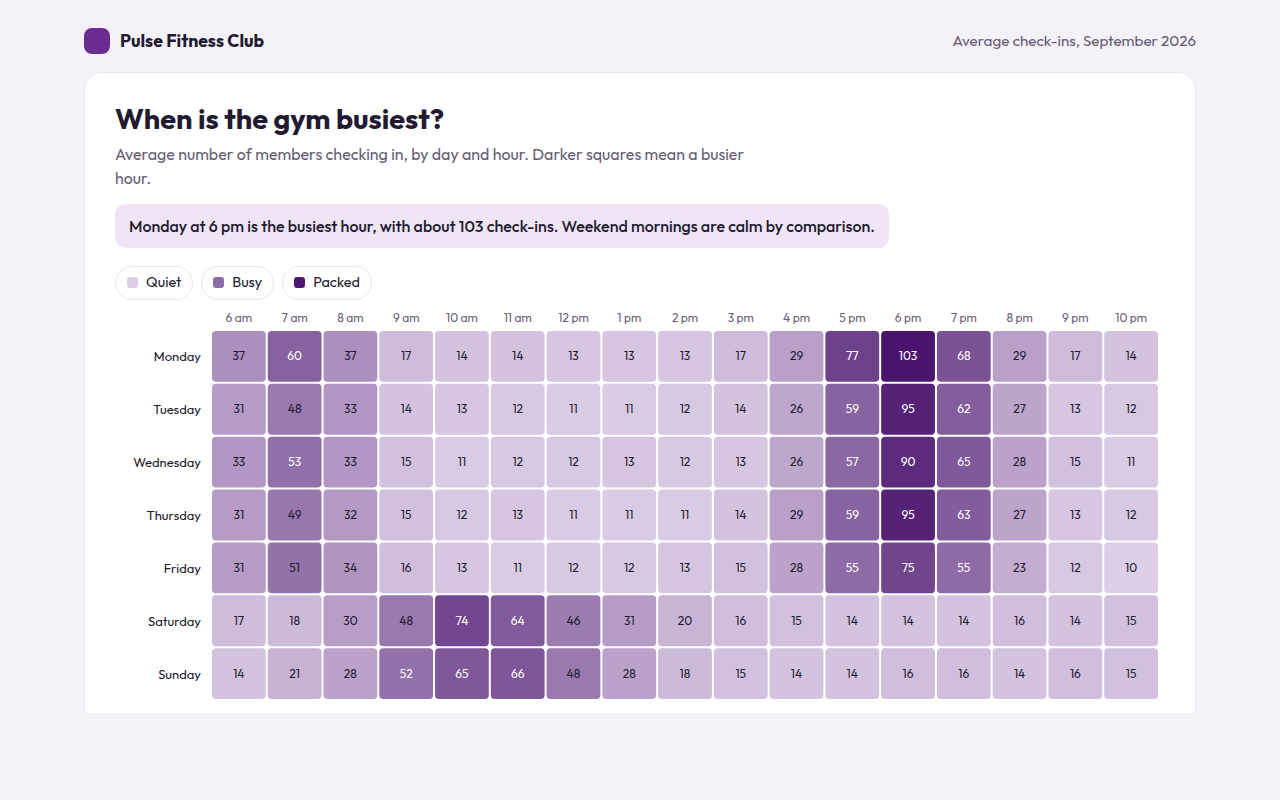
043. Heatmap
Example: gym check-ins by day and hour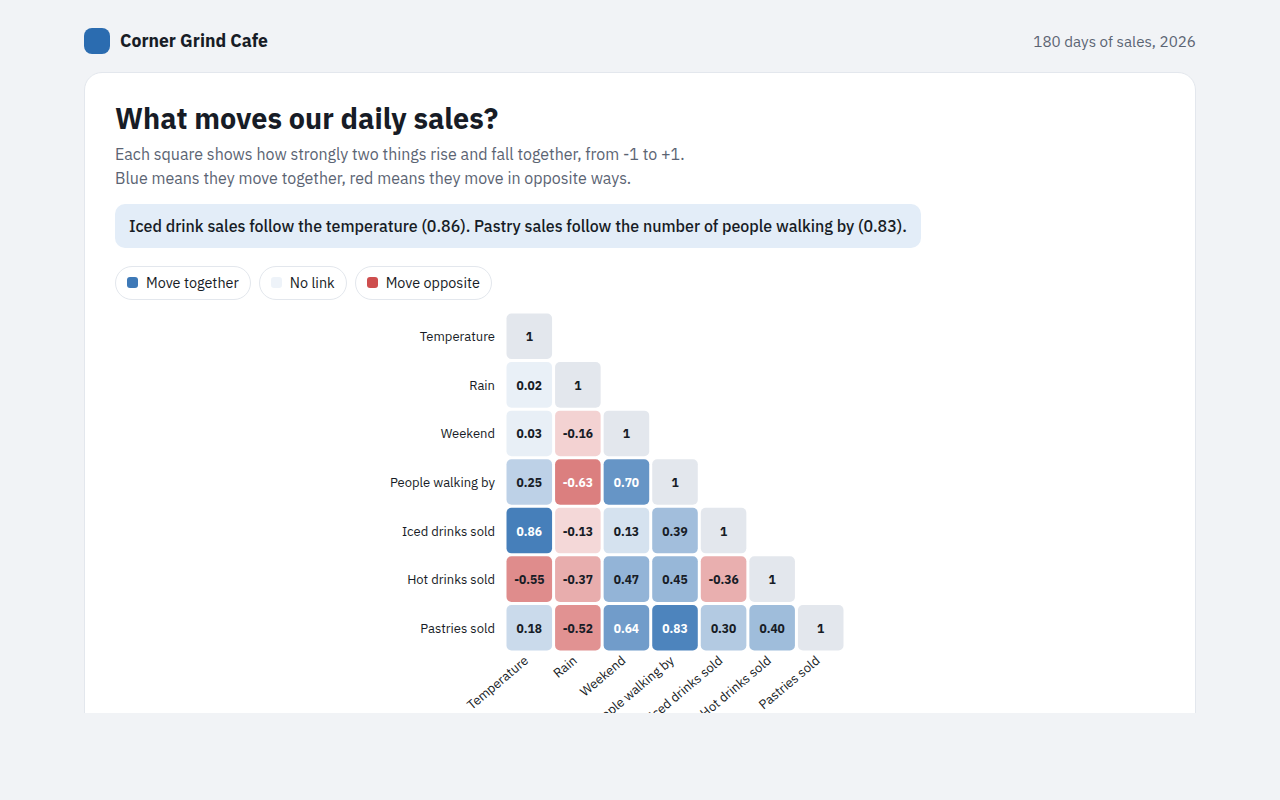
044. Correlation Matrix
Example: what drives daily sales at a cafe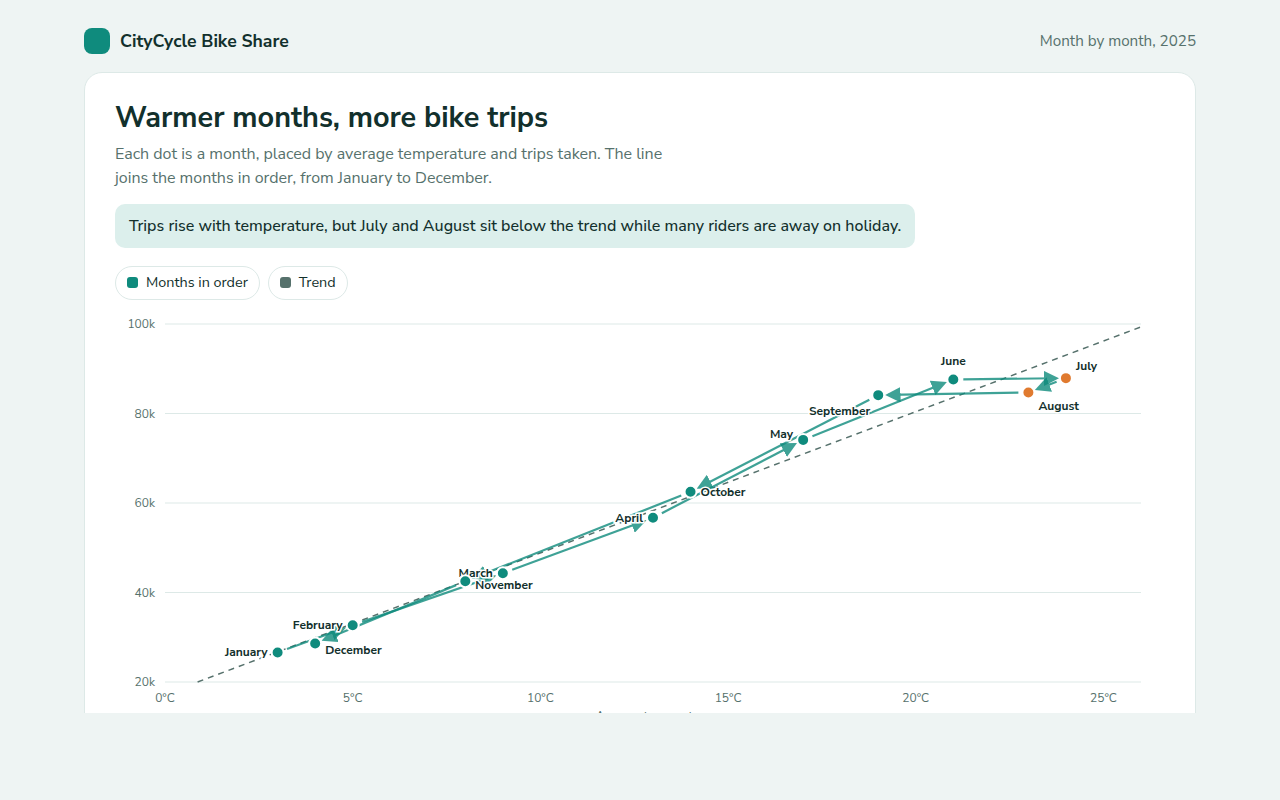
045. Connected Scatter Plot
Example: monthly bike share trips against average temperature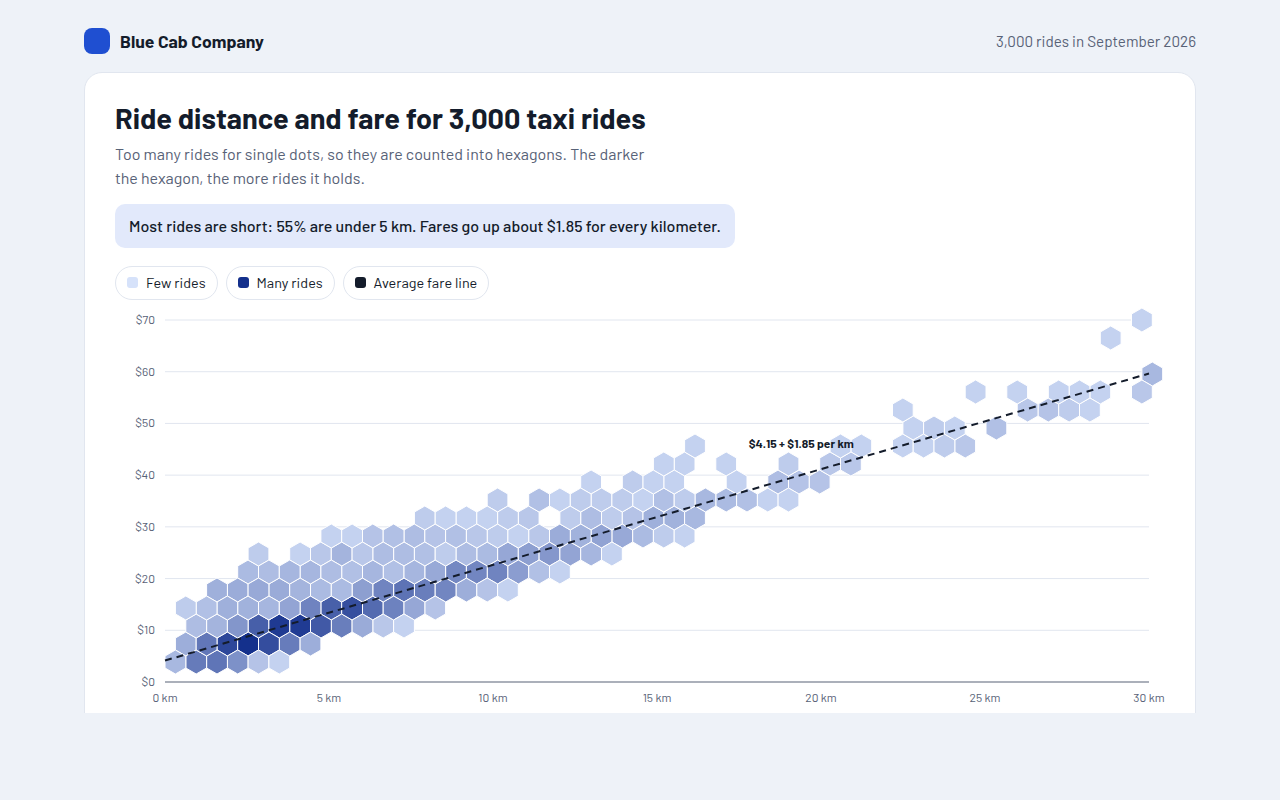
046. Hexbin Plot
Example: distance and fare for 3,000 taxi rides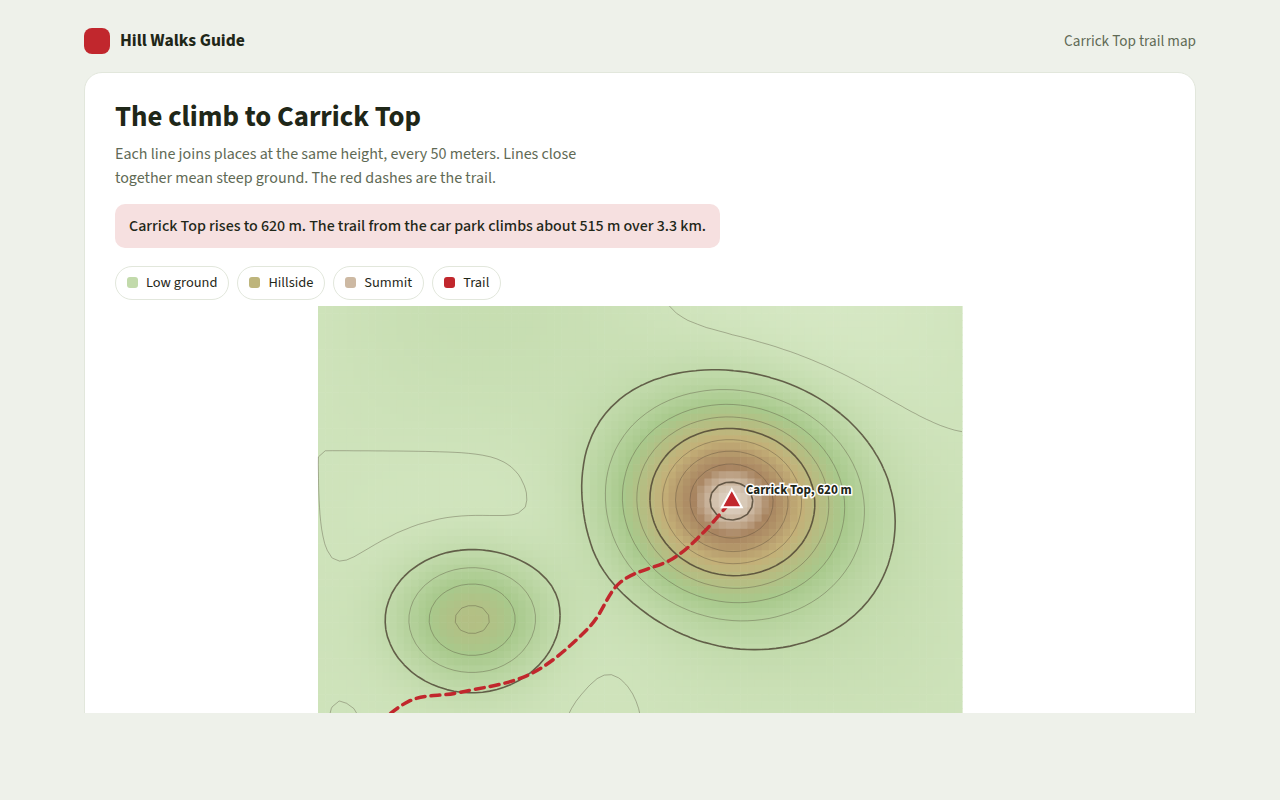
047. Contour Plot
Example: a hill walk with height lines and a trail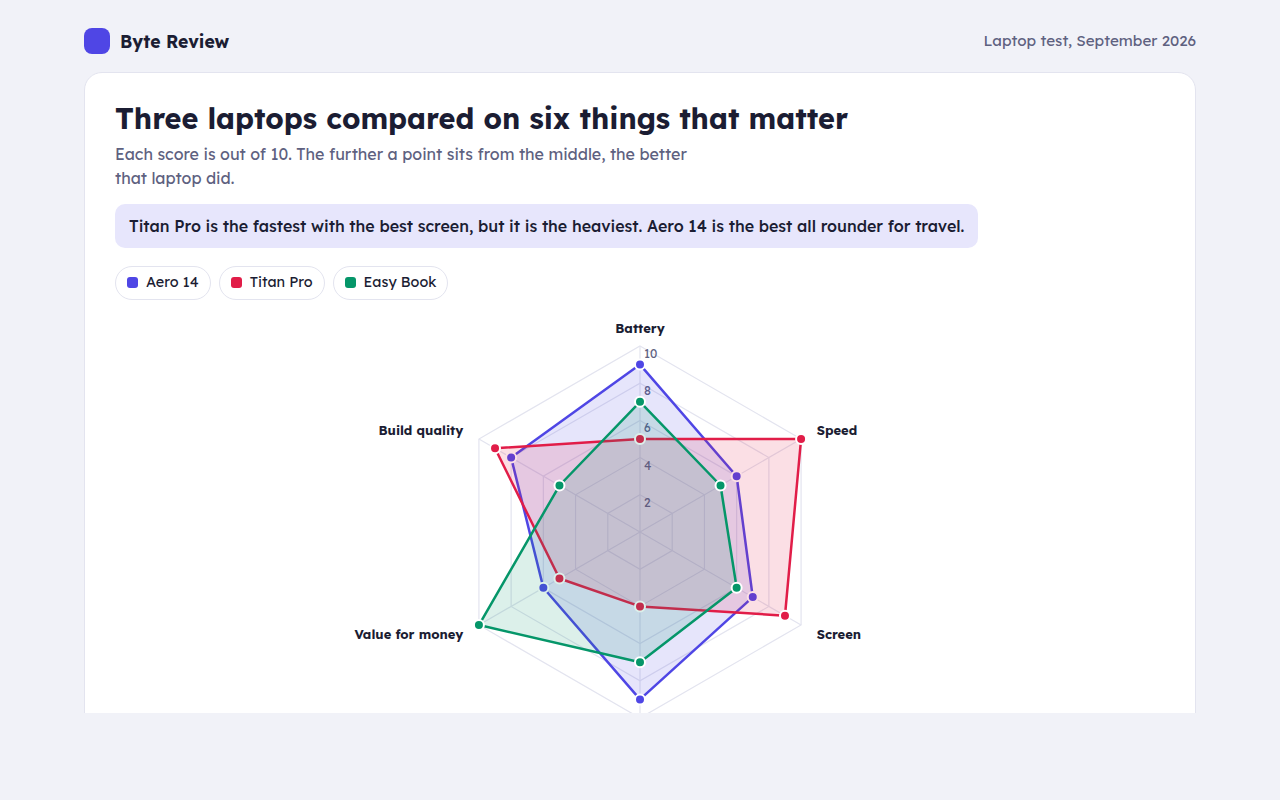
048. Radar Chart
Example: three laptops scored on six features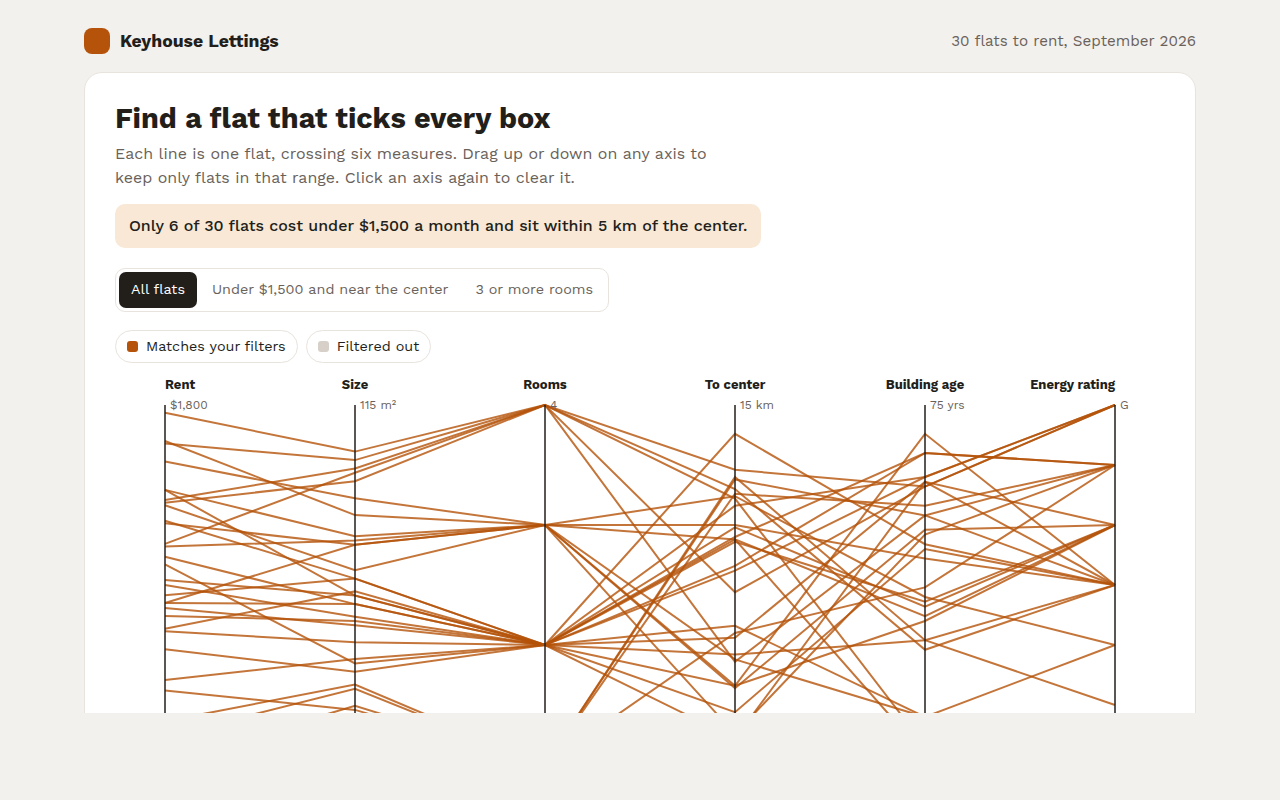
049. Parallel Coordinates Chart
Example: rental flats compared on six measures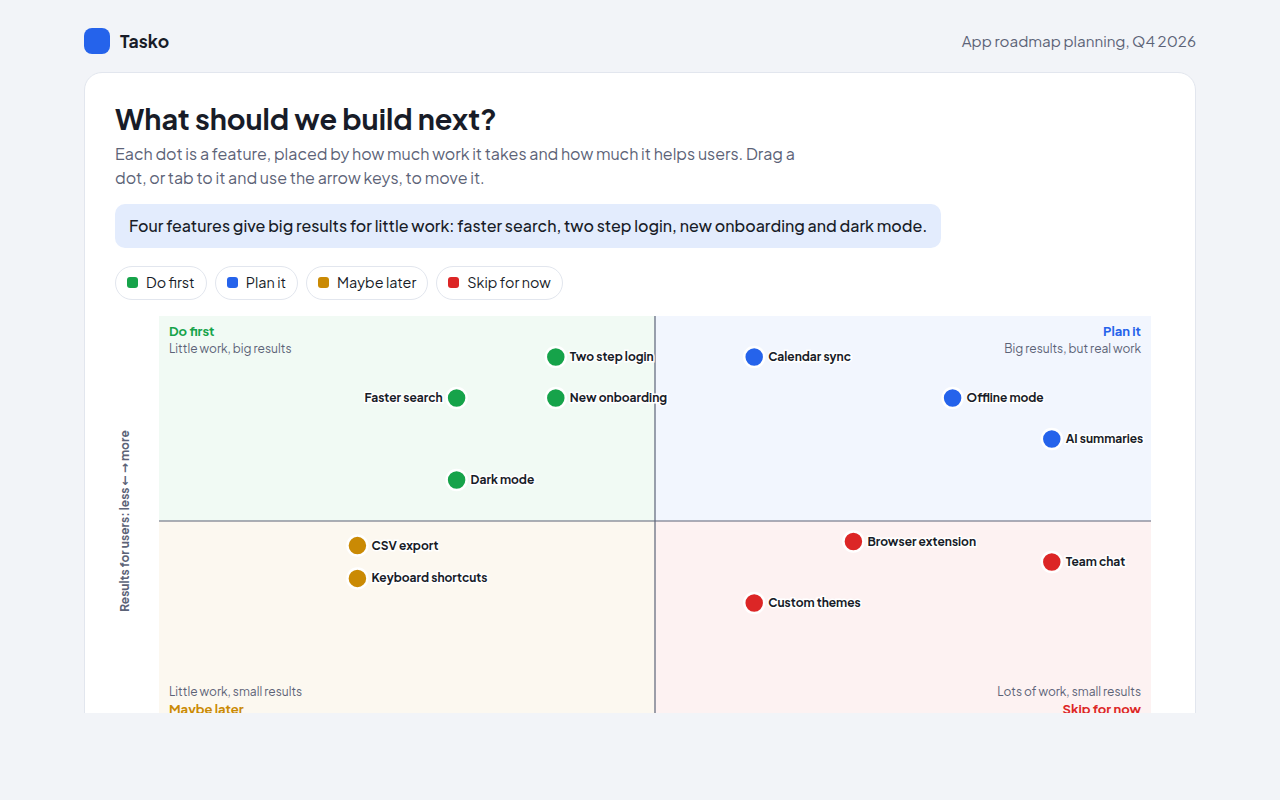
050. Quadrant Chart
Example: app features sorted by effort and impact6. Flow and Network
See all 10 flow and network
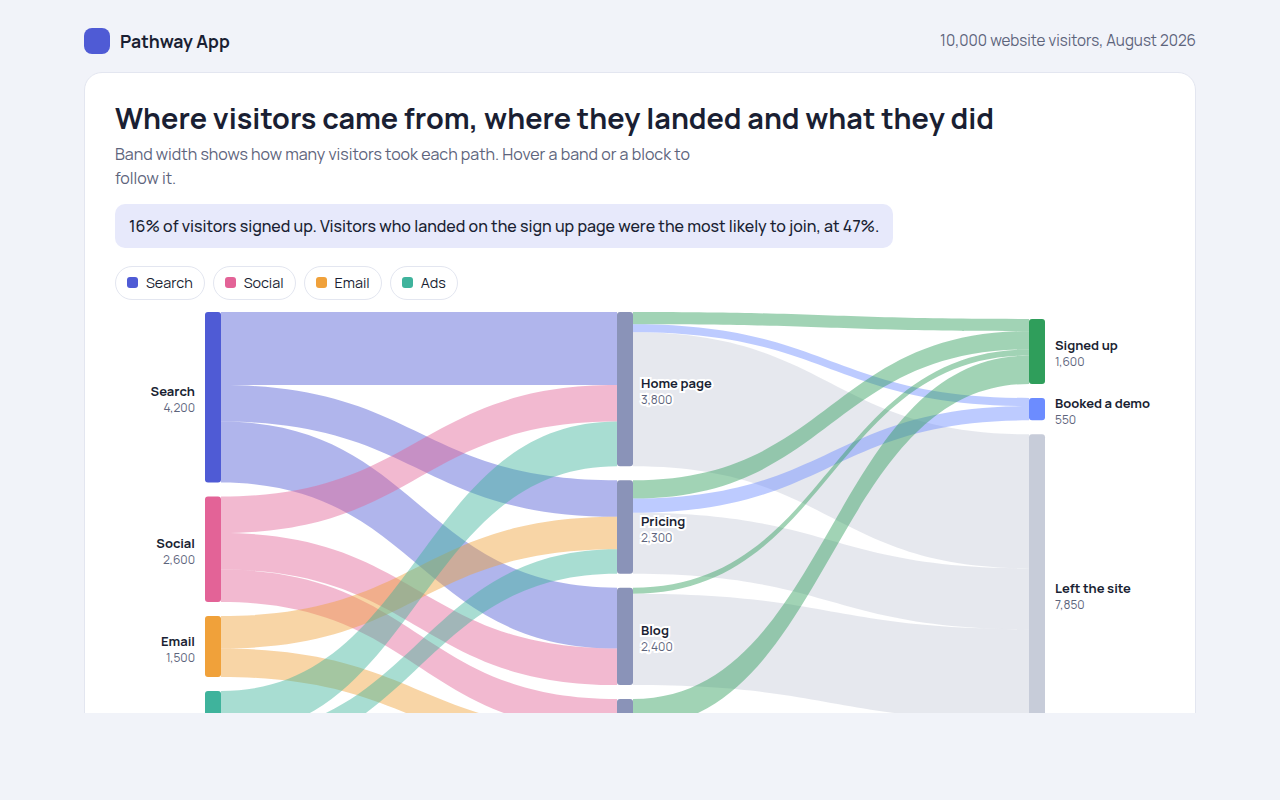
051. Sankey Diagram
Example: website visitors from source to landing page to outcome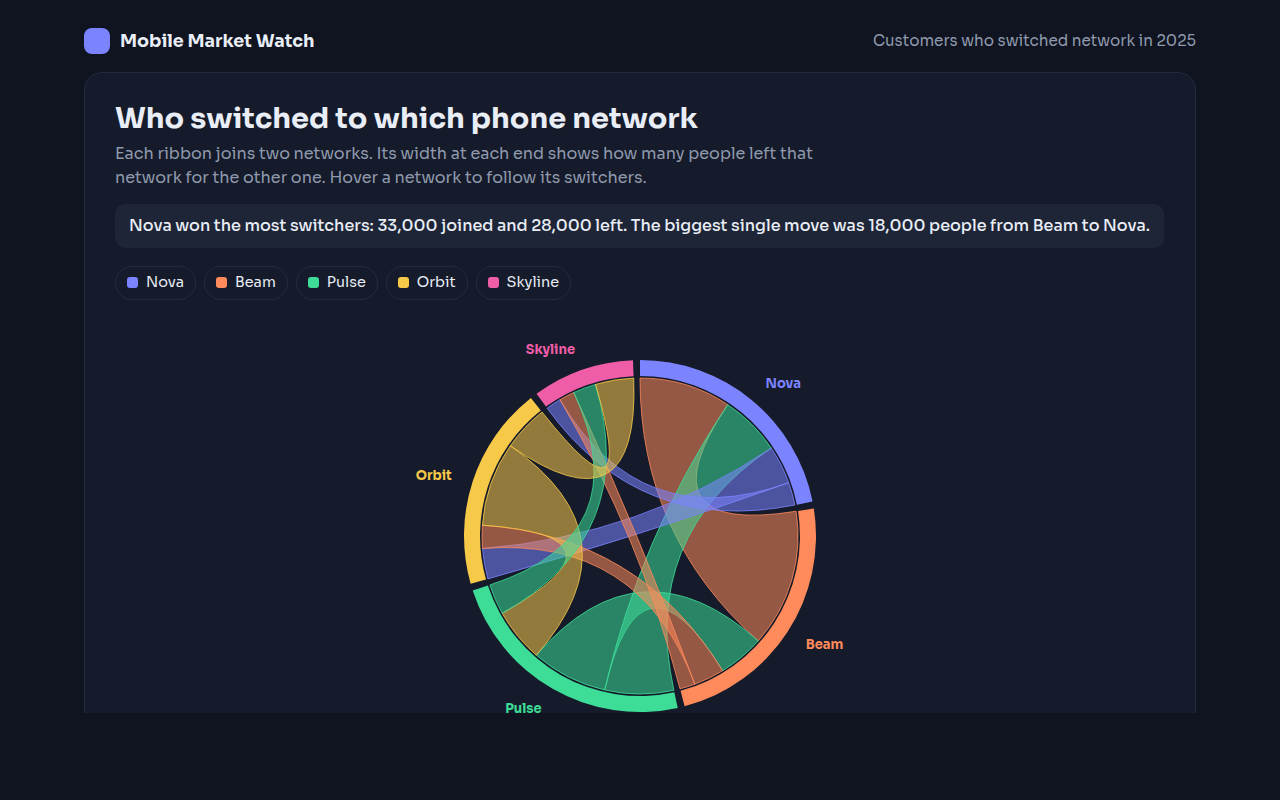
052. Chord Diagram
Example: customers switching between five phone networks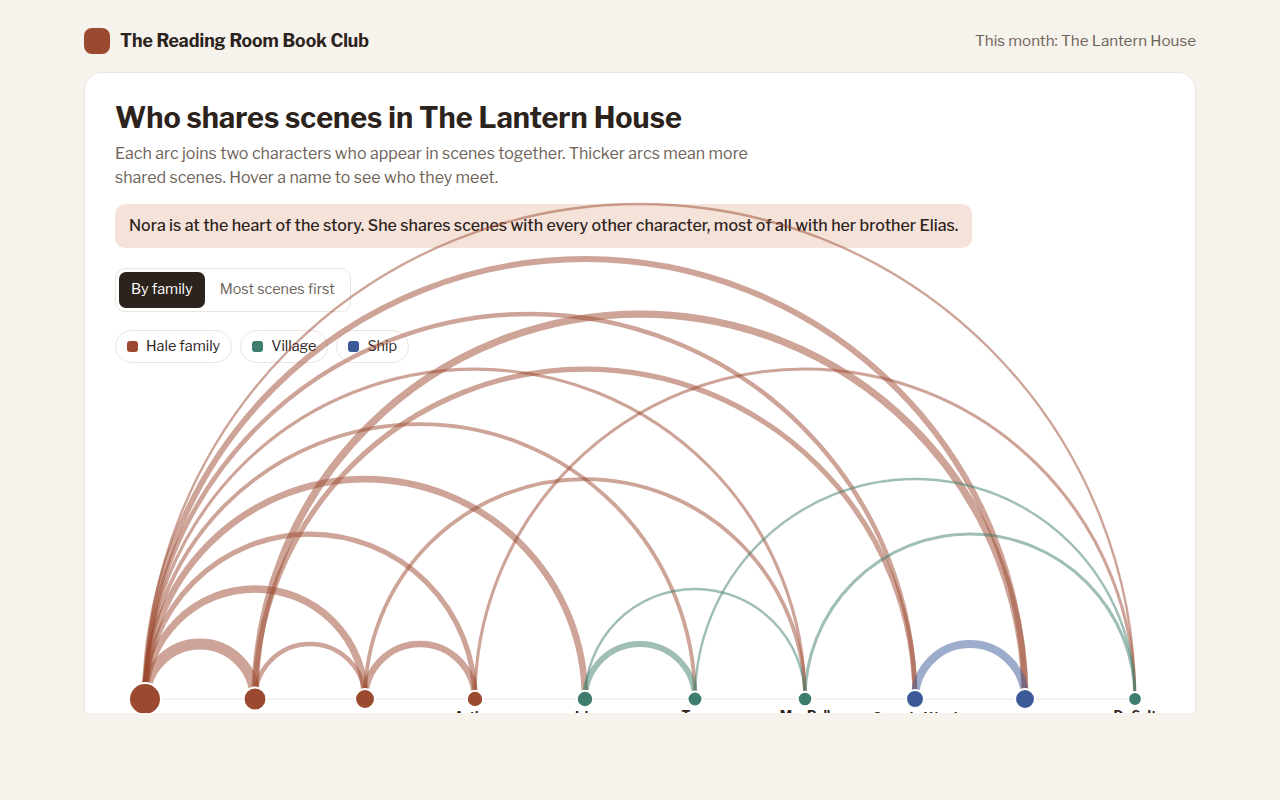
053. Arc Diagram
Example: characters who share scenes in a novel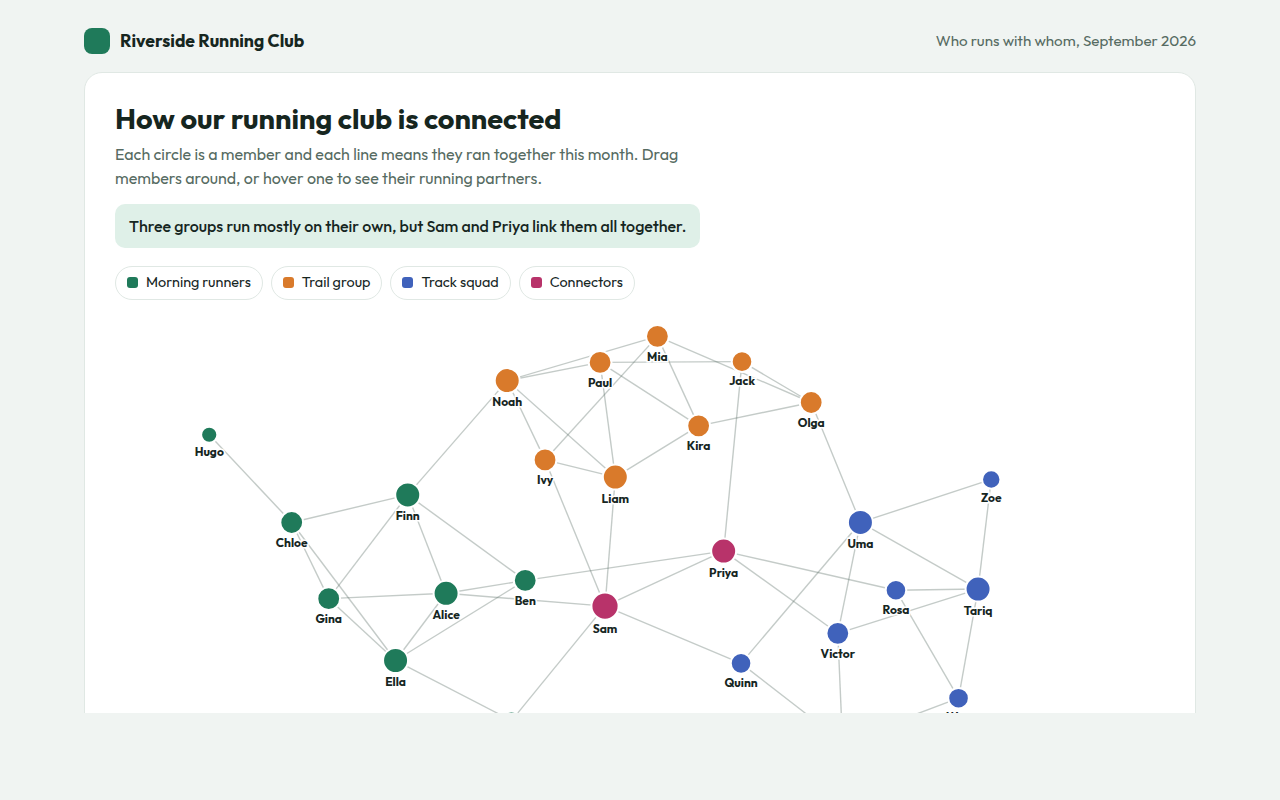
054. Network Graph
Example: who runs with whom in a running club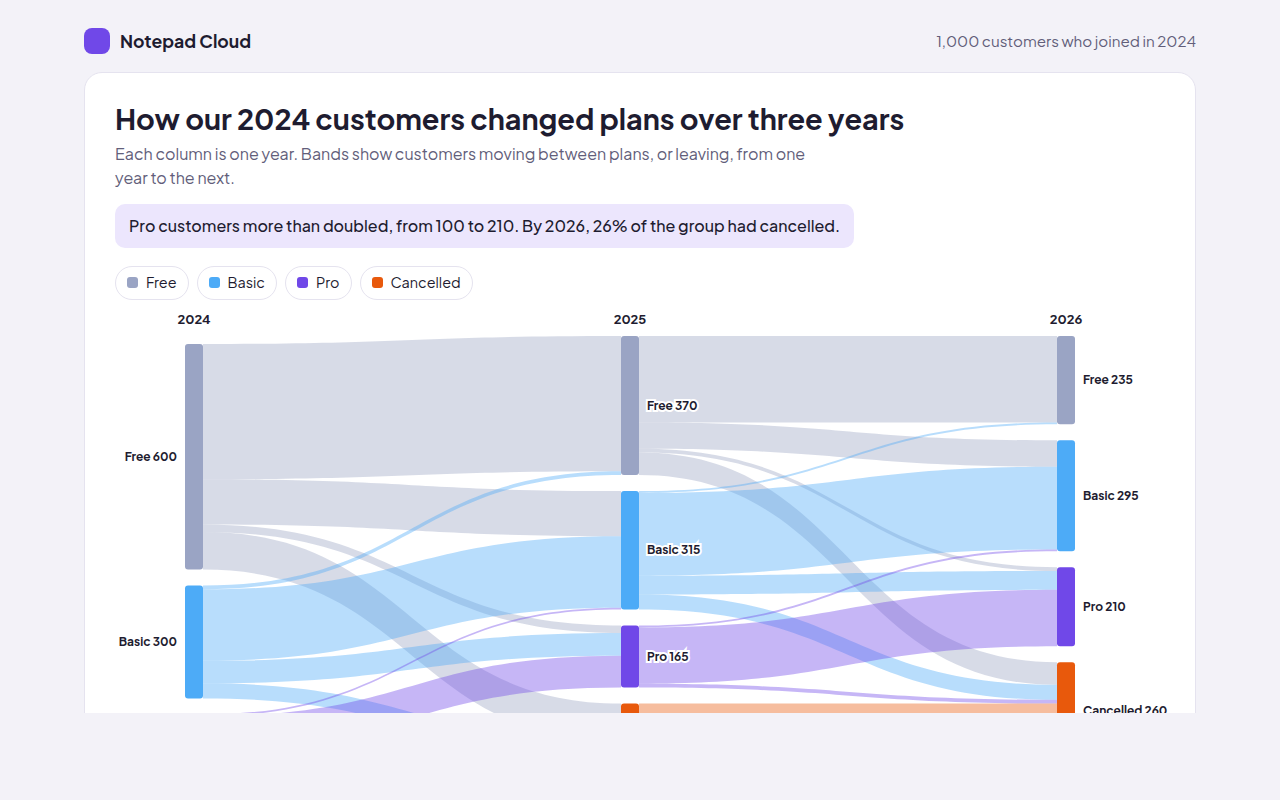
055. Alluvial Diagram
Example: customers changing plans over three years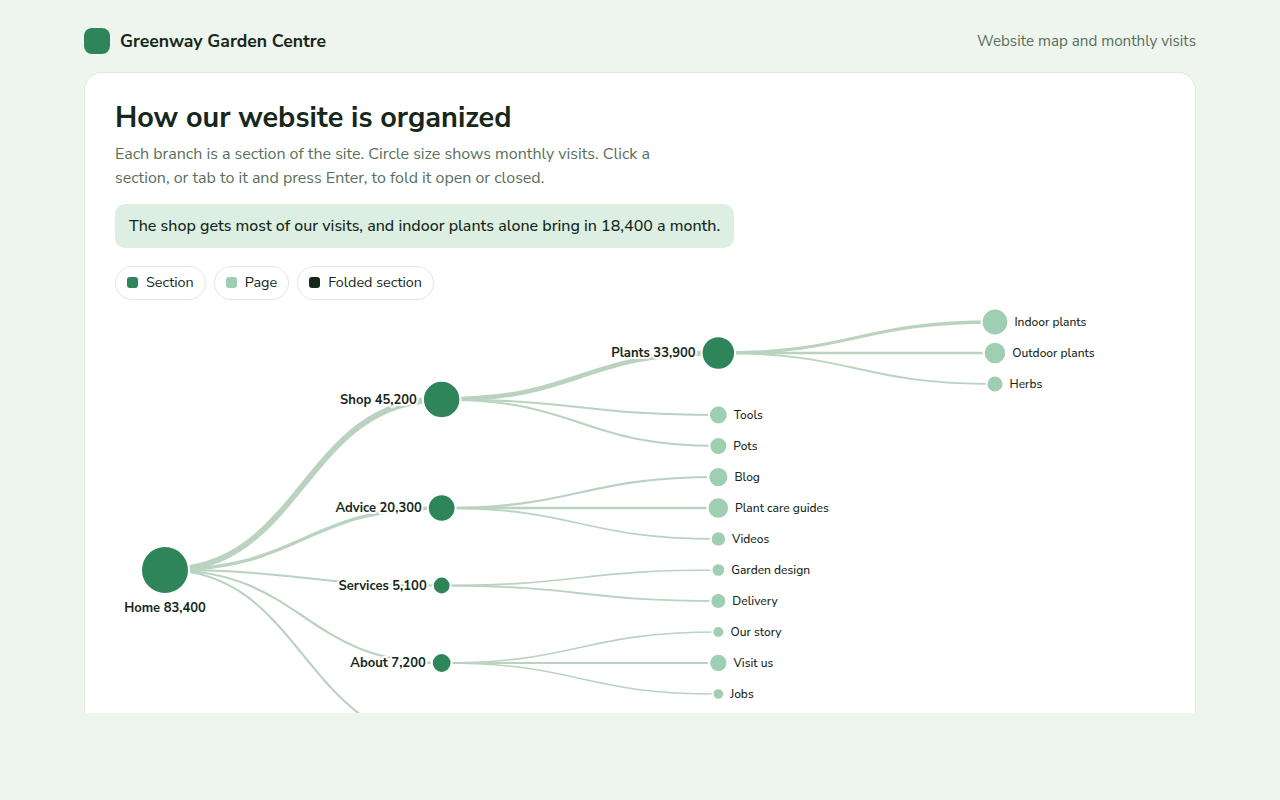
056. Tree Diagram
Example: a garden centre website map with monthly visits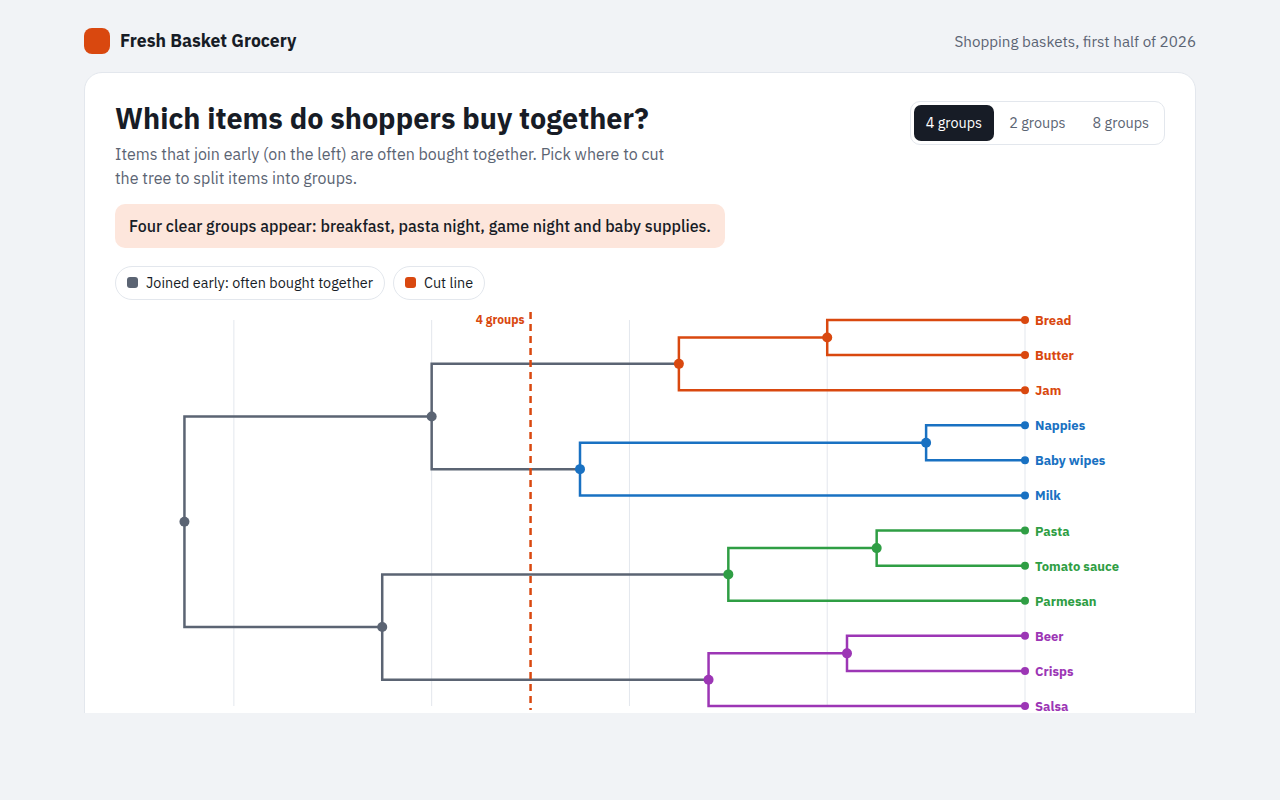
057. Dendrogram
Example: grocery items that shoppers buy together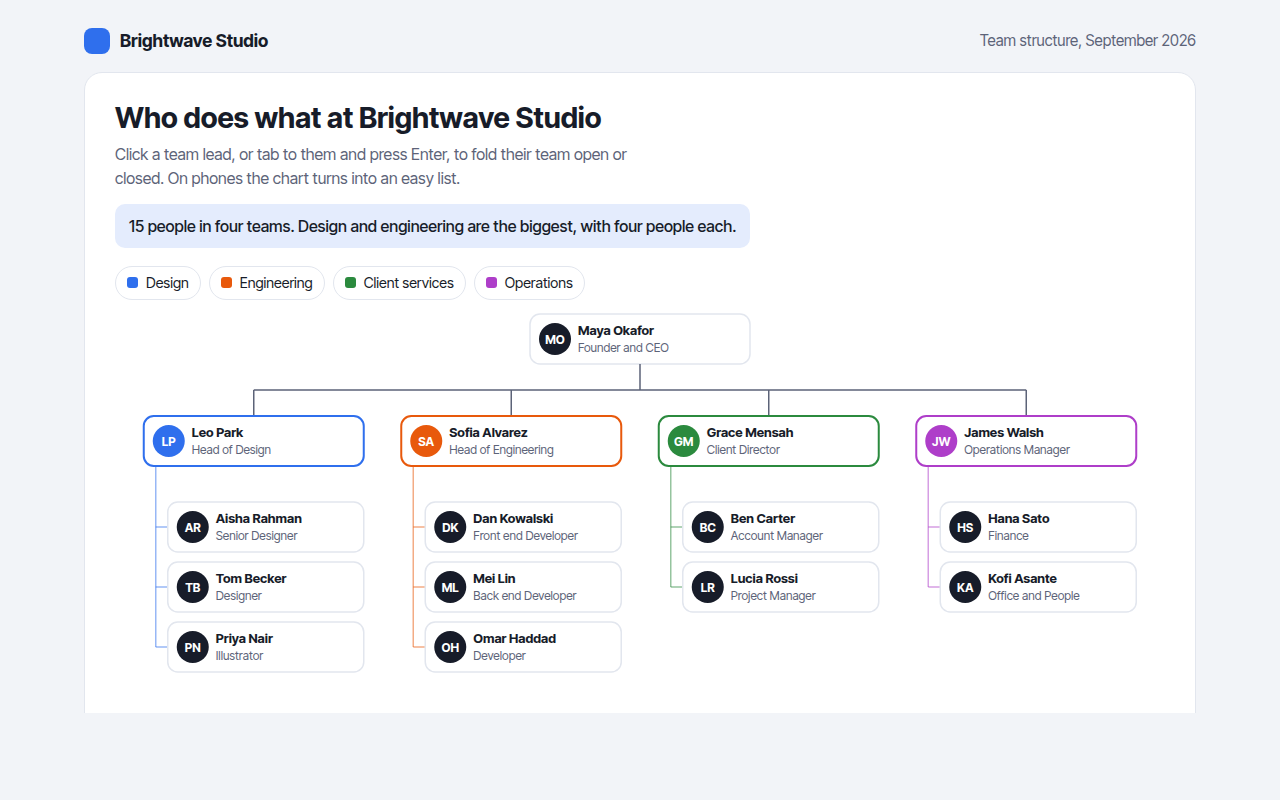
058. Org Chart
Example: the team structure of a design studio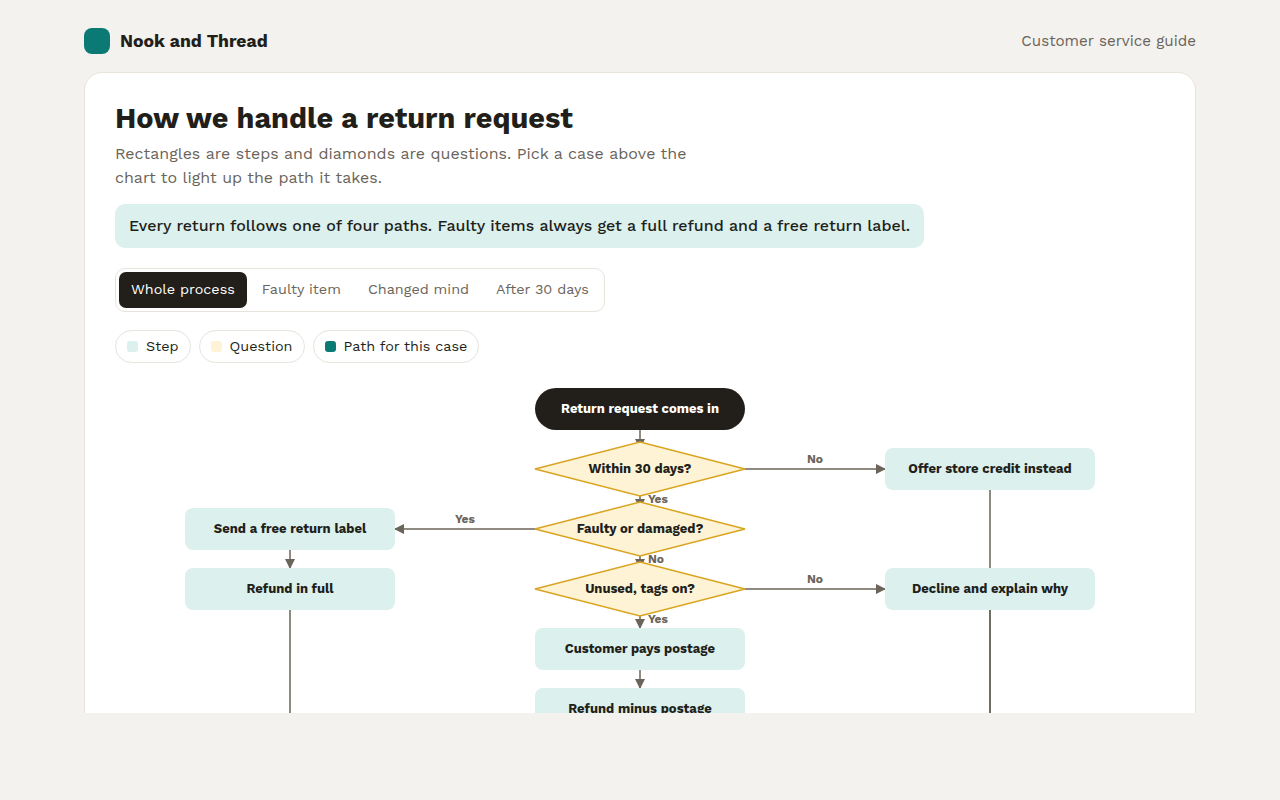
059. Flowchart
Example: how an online shop handles a return request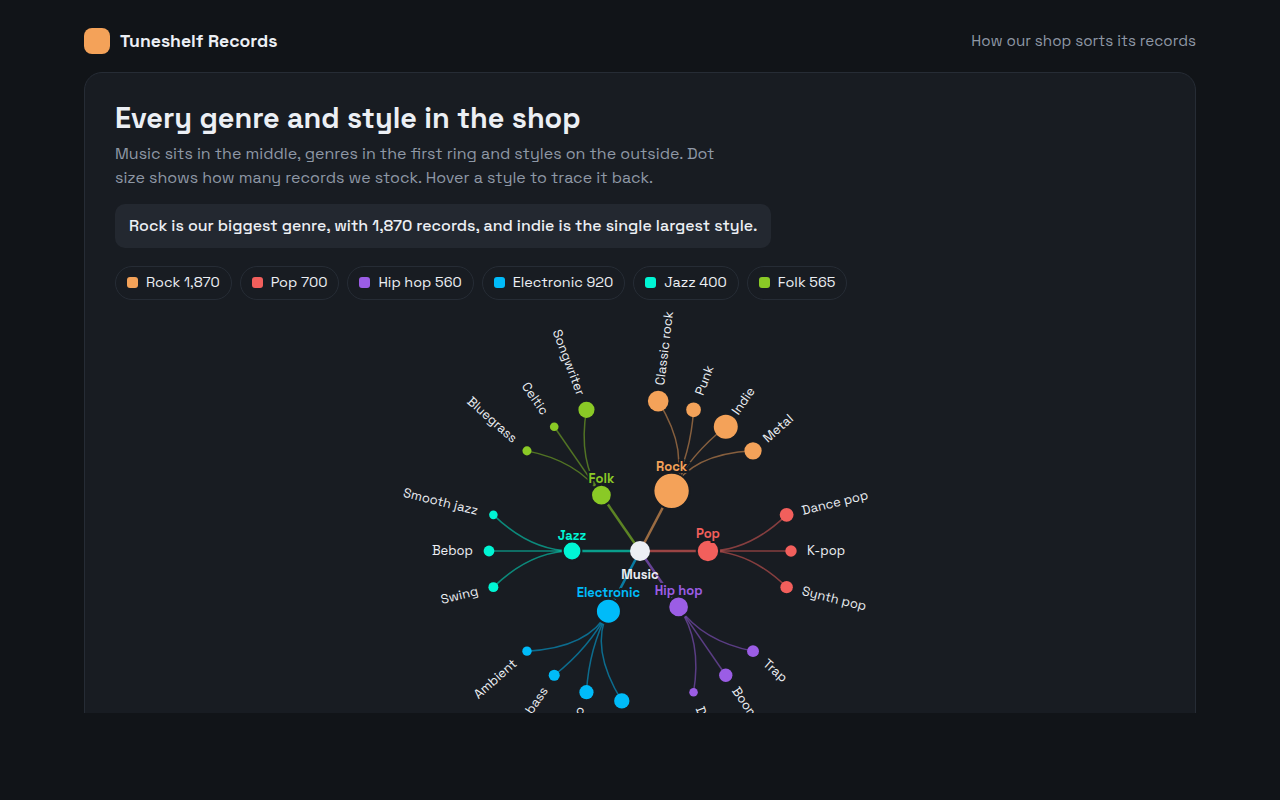
060. Radial Tree
Example: every music genre and style in a record shop7. Dashboard Widgets
See all 10 dashboard widgets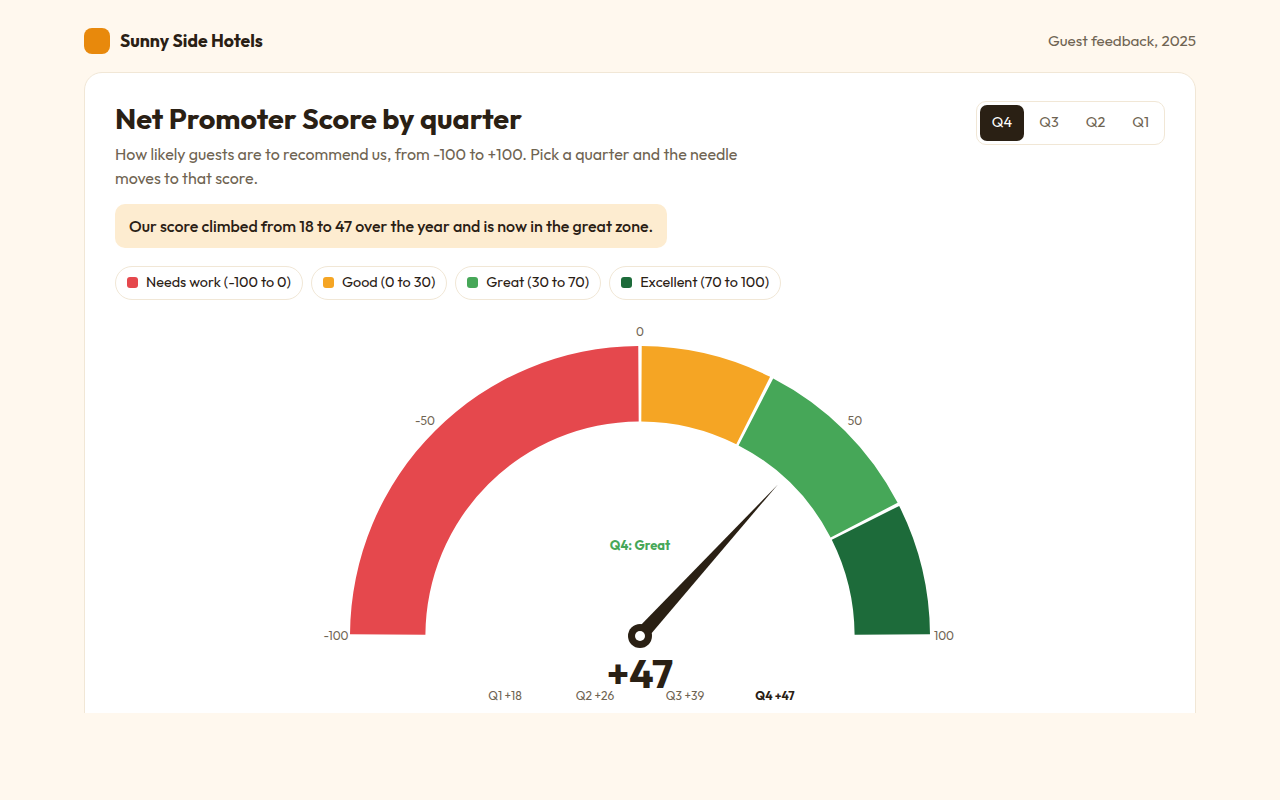
061. Gauge Chart
Example: a hotel Net Promoter Score by quarter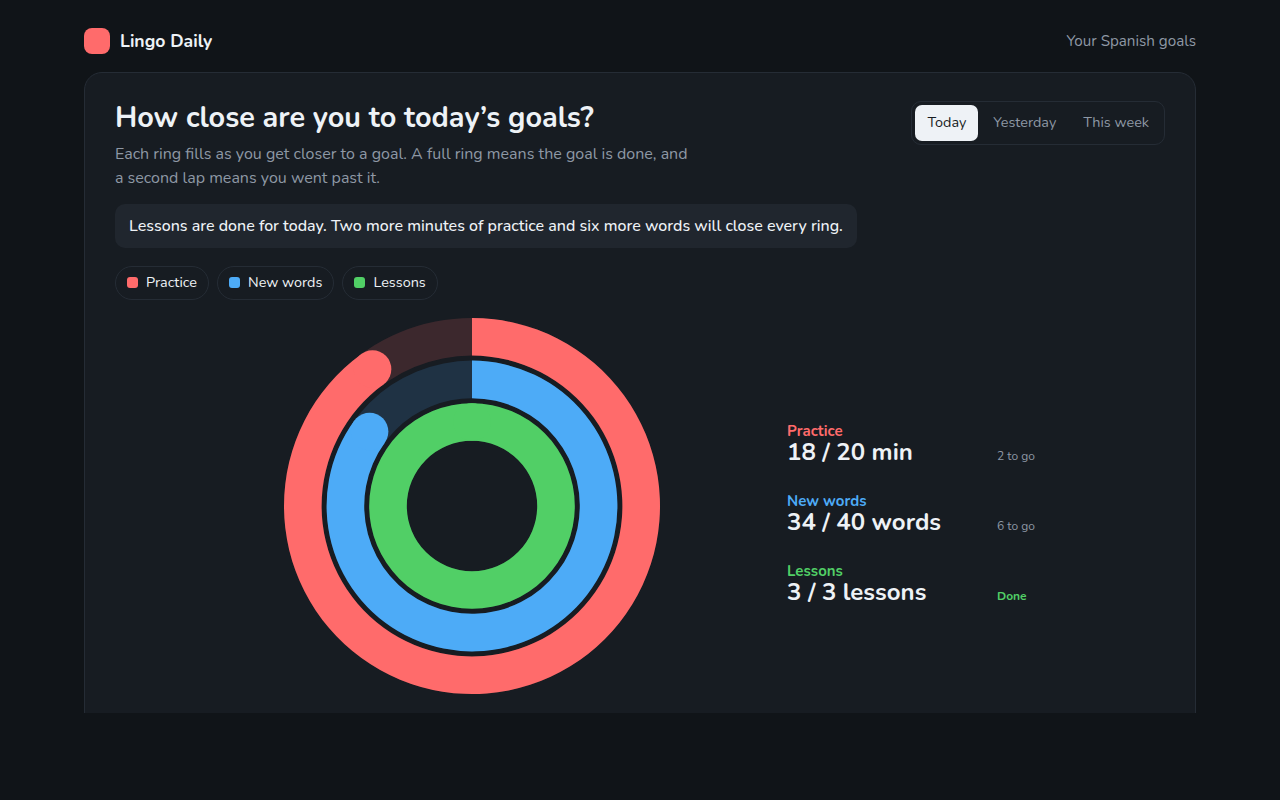
062. Progress Ring Chart
Example: daily goals in a language learning app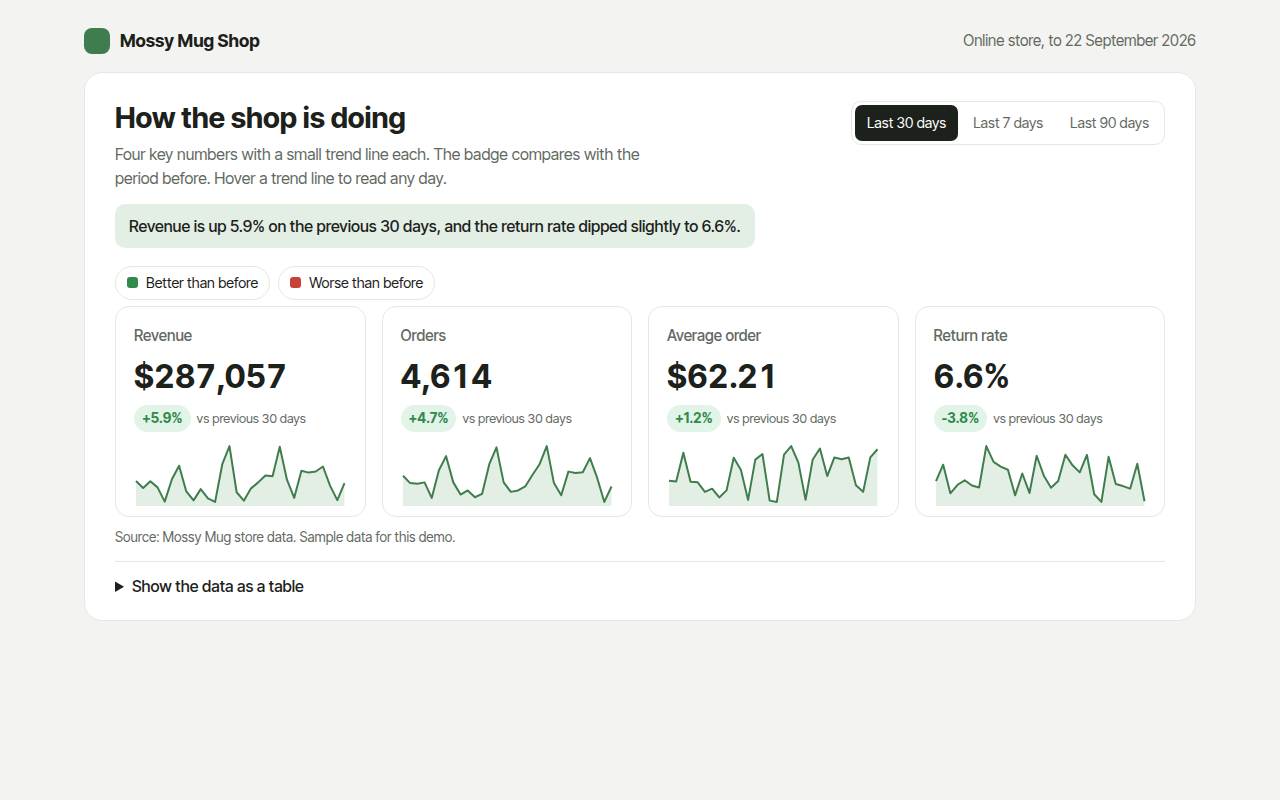
063. KPI Cards with Sparklines
Example: revenue, orders, average order and returns for an online shop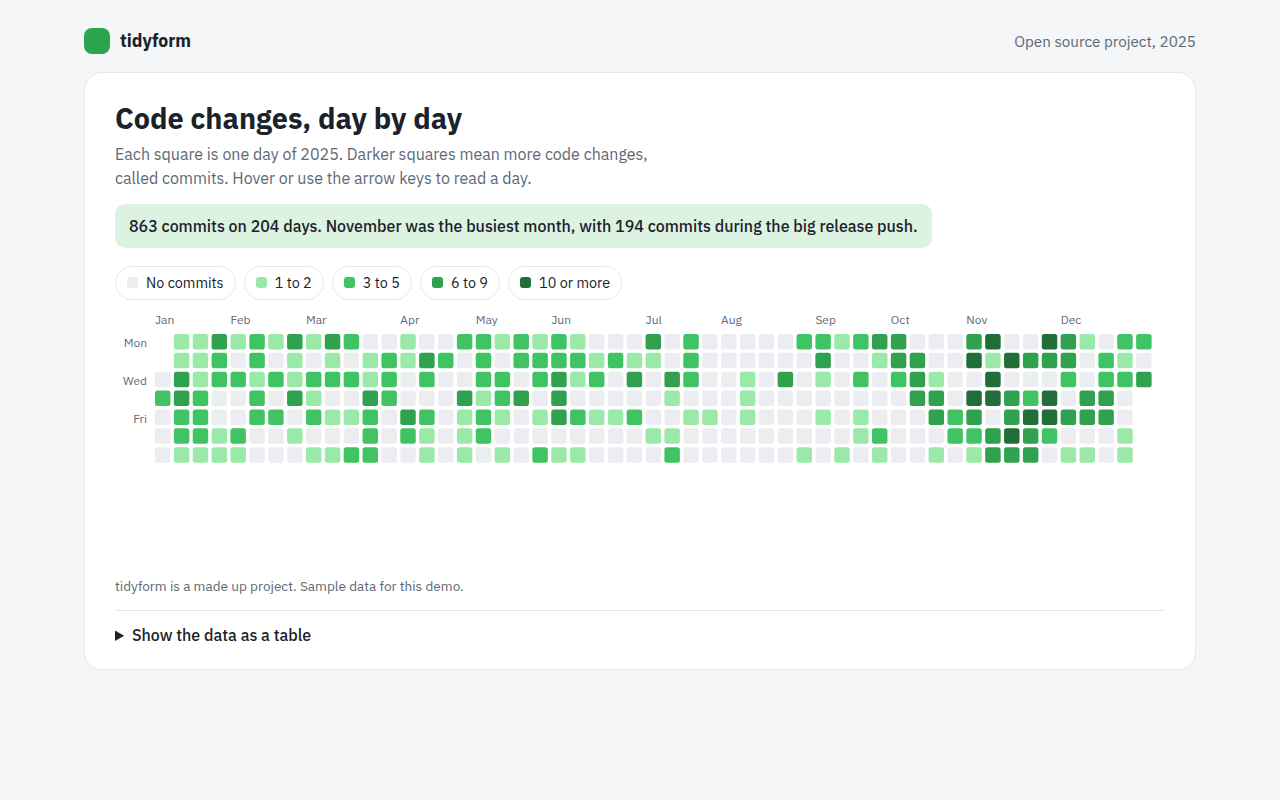
064. Calendar Heatmap
Example: a year of code changes on an open source project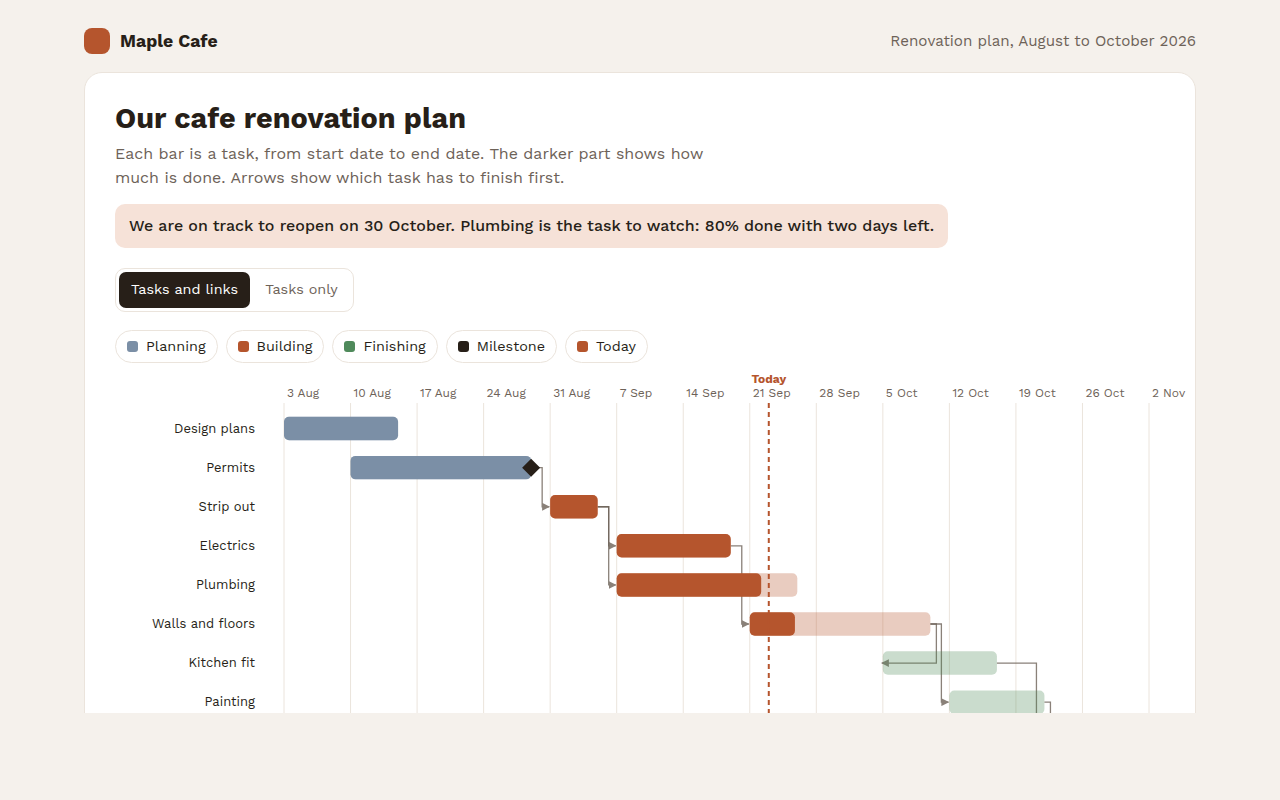
065. Gantt Chart
Example: a cafe renovation plan with tasks and milestones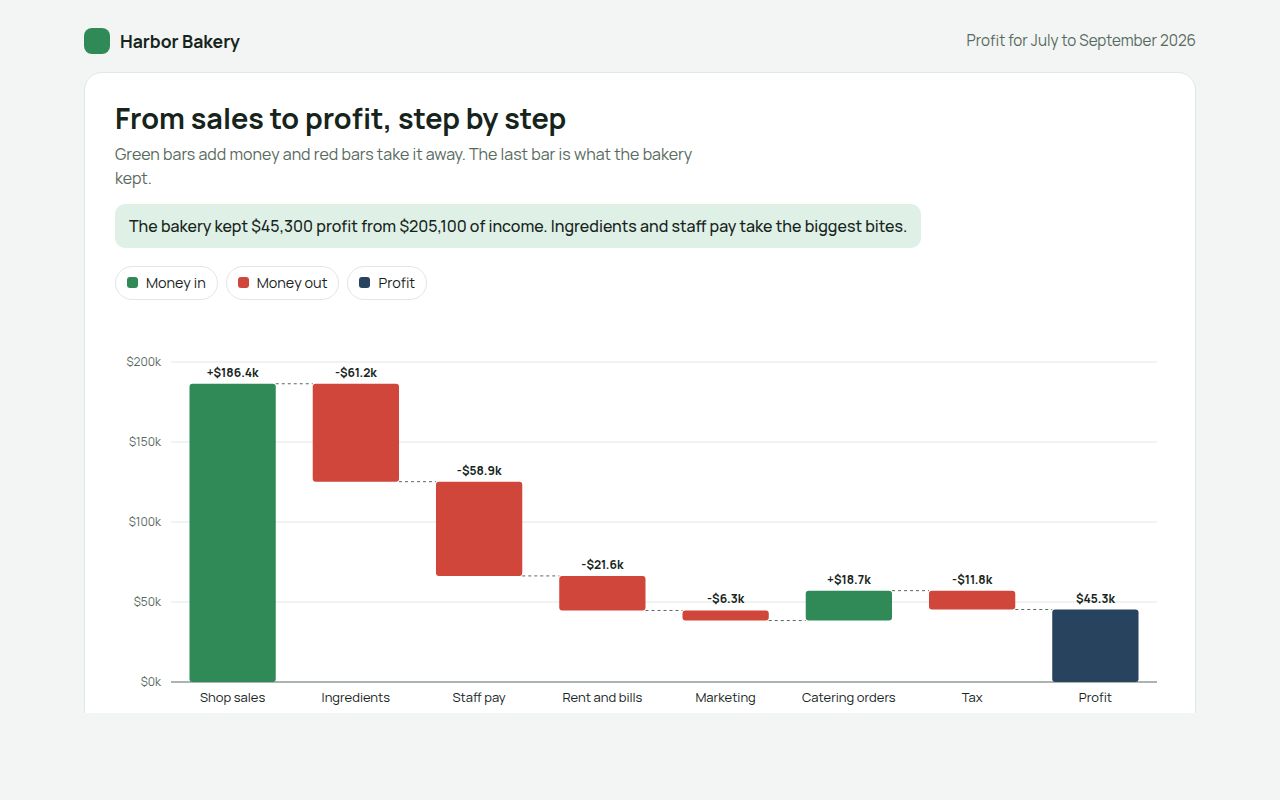
066. Waterfall Chart
Example: how a bakery turns sales into profit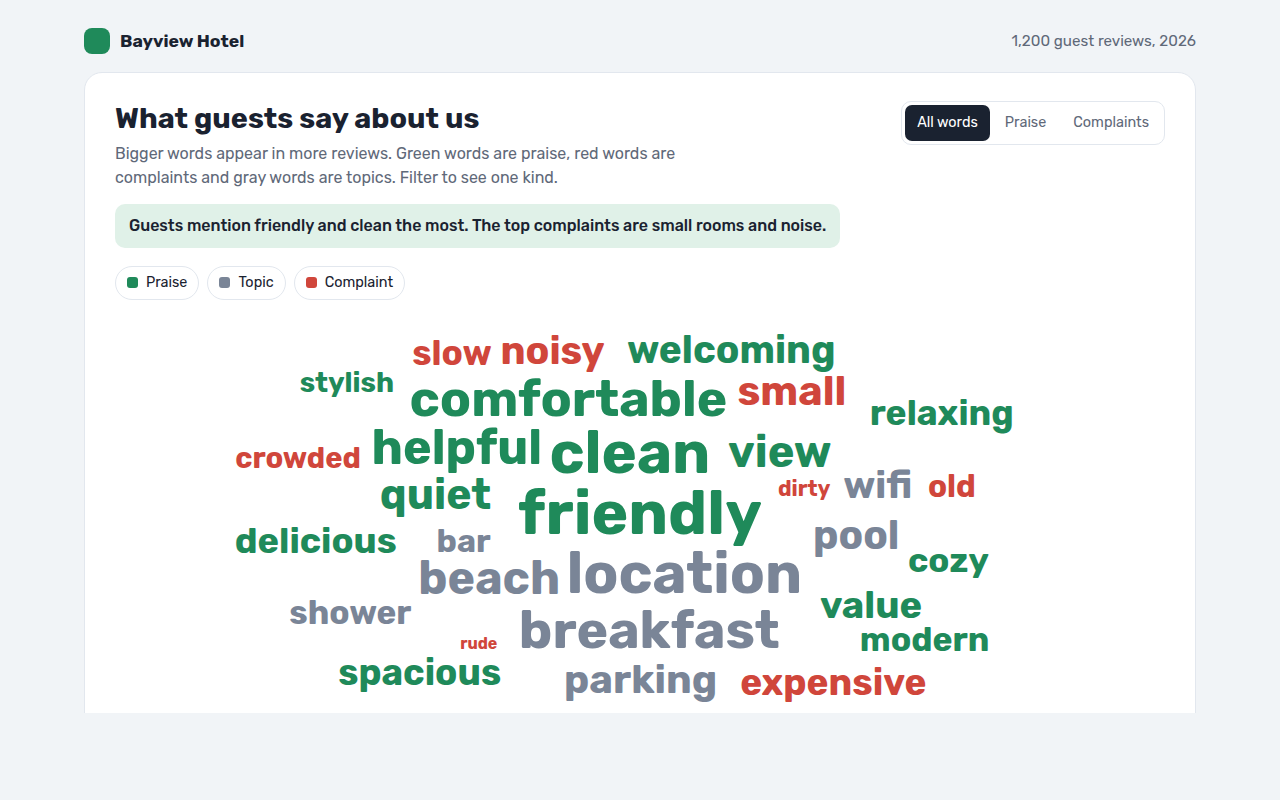
067. Word Cloud
Example: words guests use in hotel reviews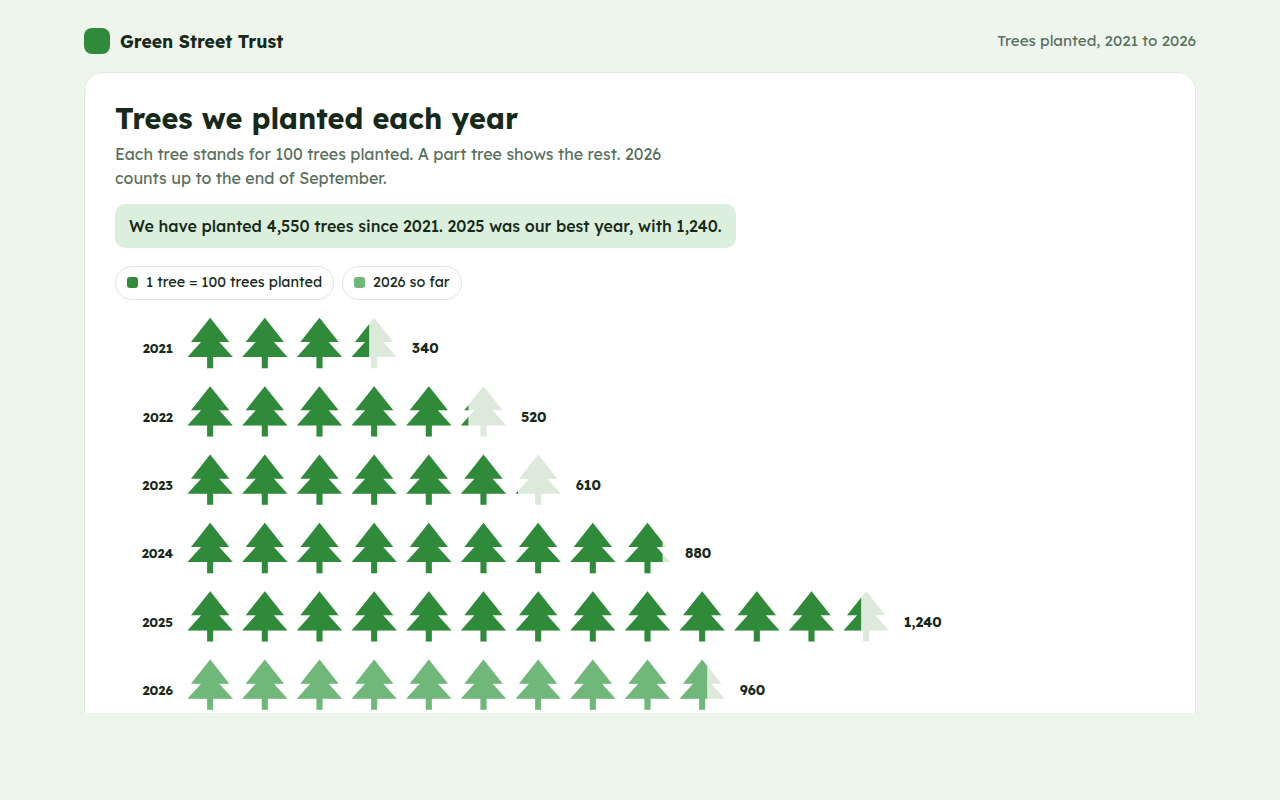
068. Pictogram Chart
Example: trees planted by a charity each year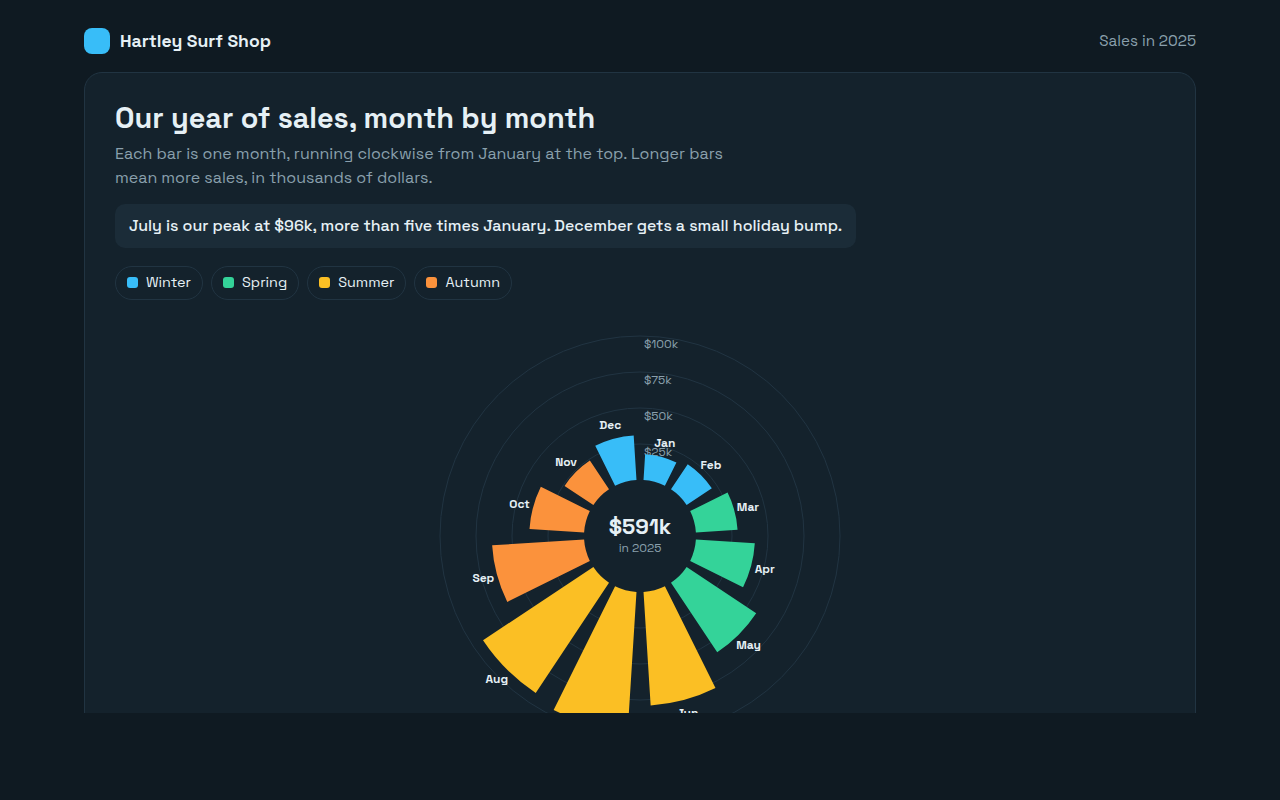
069. Radial Bar Chart
Example: monthly sales for a surf shop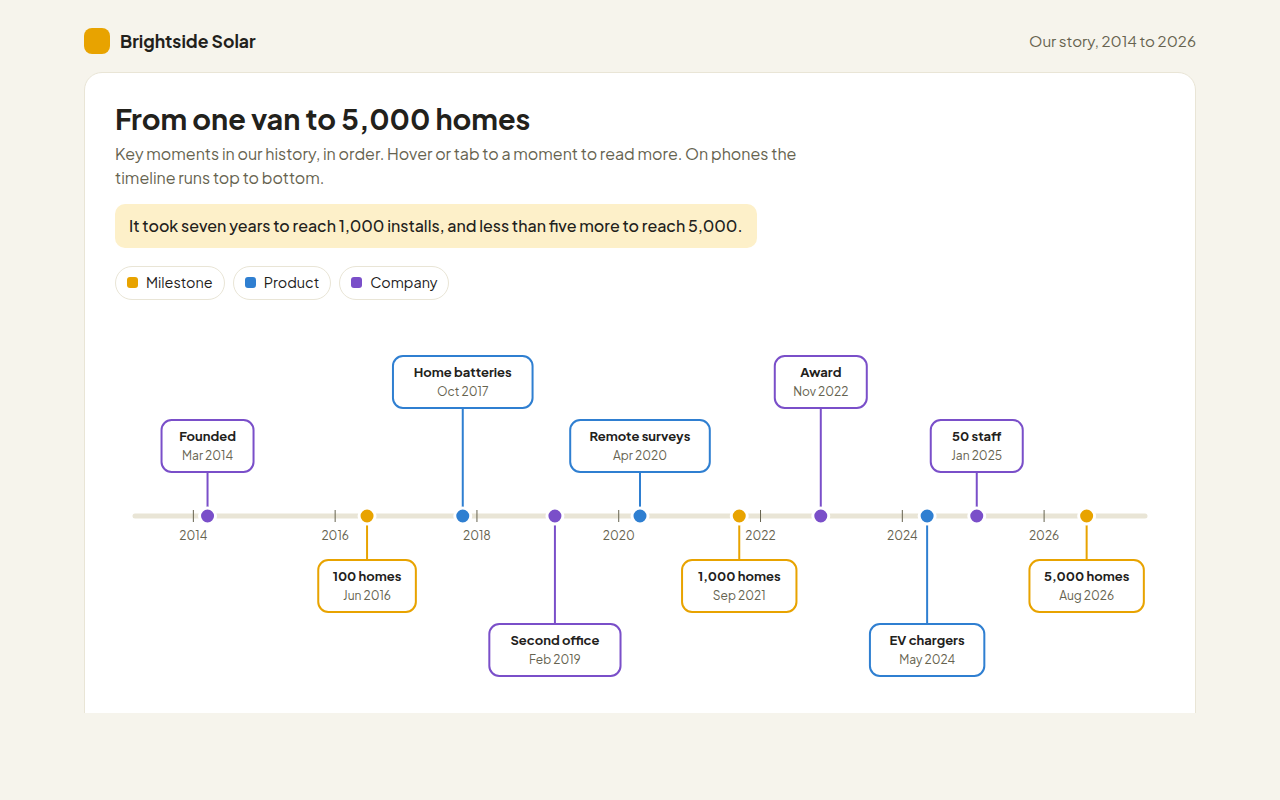
070. Timeline
Example: the history of a solar installer from 2014 to 2026Questions people ask
Are these charts really free?
Yes. Every chart is released under the MIT license. You can use them on personal sites, client work and paid products without asking.
Do I need a chart library like Chart.js or D3?
No. Every chart is drawn with plain SVG and vanilla JavaScript. There is nothing to install and no library to load, so pages stay small and fast.
How do I use one of these charts on my website?
Open the chart, click Download HTML file, replace the numbers in the DATA list with your own and upload the file. You can also copy the SVG and script into an existing page.
Do the charts work on phones?
Yes. Every chart redraws itself to fit the screen, moves labels on small screens and supports touch, mouse and keyboard.
Are the charts accessible?
Each value can be reached with the Tab key and read out by screen readers, and every chart includes a data table. Animations turn off for people who prefer reduced motion.