Home / Relationships / Parallel Coordinates Chart
Parallel Coordinates Chart in HTML, CSS and JavaScript
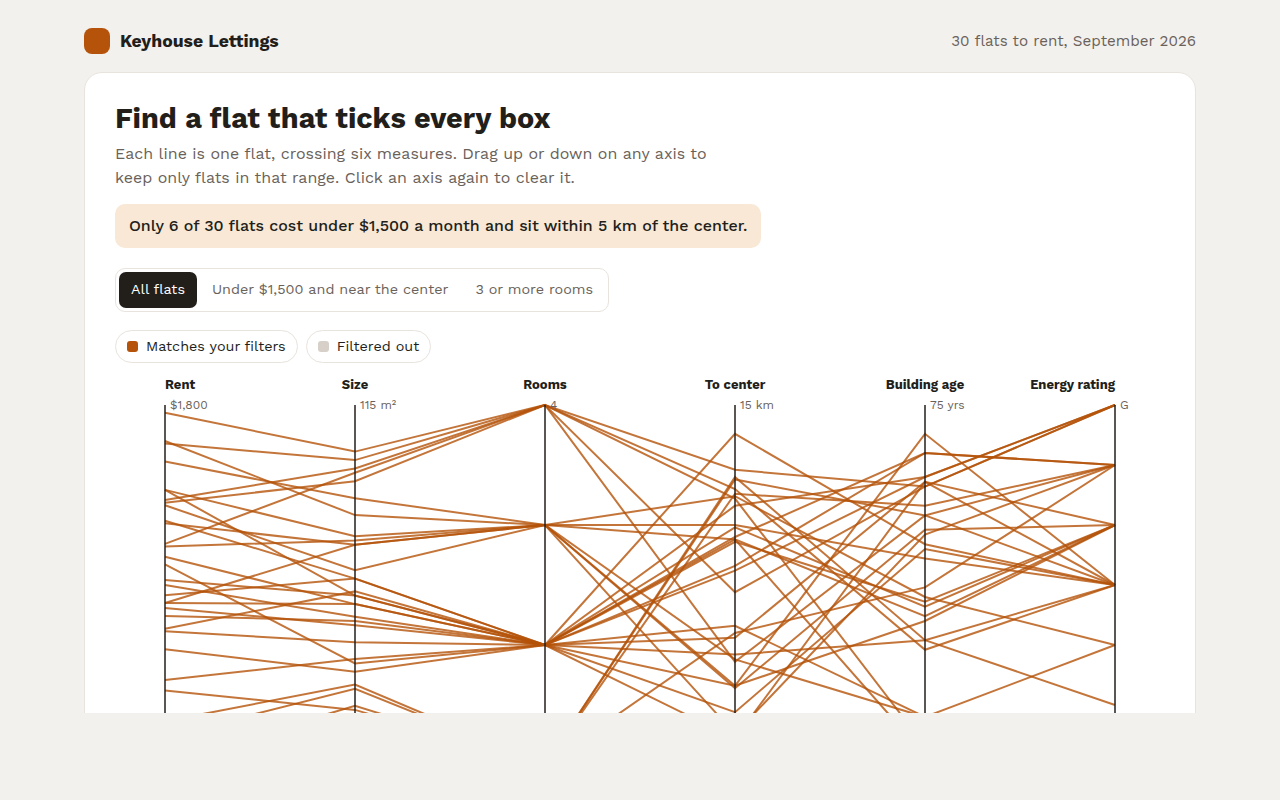
A parallel coordinates chart shows many measures side by side as vertical axes. This free template draws one with plain SVG and vanilla JavaScript, no chart library. The example shows rental flats compared on six measures.
What is a parallel coordinates chart?
A parallel coordinates chart shows many measures side by side as vertical axes. Each item is a line that crosses every axis at its value, so you can follow one flat across rent, size, rooms, distance and more.
Its real power is filtering. Drag on an axis to keep only the items in that range, and the rest fade away. It turns a big table into a tool for finding the few options that tick every box.
At a glance
- Best for
- Filtering many items across many measures
- Data you need
- Several numbers for each item
- Skip it when
- Readers who need a quick, simple picture.
- Made with
- HTML, CSS and vanilla JavaScript. No library.
When to use a parallel coordinates chart
- Choosing a flat, car or laptop from many options
- Comparing products on many specs
- Finding patterns in survey or sensor data
- Screening candidates, suppliers or stocks
When to pick another chart
- Radar Chart: you only compare two or three items
- Correlation Matrix: you want to see which measures are linked
What you get in this template
- Six axes, each with its own scale and units
- Drag up or down on any axis to filter, click to clear
- Quick filter buttons for common searches
- A live count of how many flats match
- Hover any line to see every value for that flat
- Short axis names on phones and a full data table
How the code works
Here is a short version of the idea behind this parallel coordinates chart. The full file adds the axis, labels, tooltips, sorting and resizing on top of it.
const axes = [['Rent', 400, 1800], ['Size', 30, 115], ['Km to center', 0, 15]];
const flats = [[1450, 62, 3.2], [980, 41, 9.5], [1720, 98, 1.4]];
const x = i => 60 + i * 240, y = (v, [, lo, hi]) => 280 - (v - lo) / (hi - lo) * 250;

axes.forEach((a, i) => { drawLine(x(i), 30, x(i), 280, '#221e1a', 1.5); drawText(x(i), 20, a[0], 'middle'); });
flats.forEach(f => {
  const pts = f.map((v, i) => x(i) + ',' + y(v, axes[i]));
  make('path', { d: 'M' + pts.join('L'), fill: 'none', stroke: '#b45309', 'stroke-width': 2 });
});
The example uses four tiny helpers that create SVG shapes. Put them above the code and it runs as is.
const svg = document.querySelector('svg');
function make(tag, attrs) {
  const n = document.createElementNS('http://www.w3.org/2000/svg', tag);
  for (const k in attrs) n.setAttribute(k, attrs[k]);
  svg.appendChild(n);
  return n;
}
function drawRect(x, y, width, height, fill) { return make('rect', { x, y, width, height, fill }); }
function drawCircle(cx, cy, r, fill) { return make('circle', { cx, cy, r, fill }); }
function drawLine(x1, y1, x2, y2, stroke, width, dash) {
  return make('line', { x1, y1, x2, y2, stroke, 'stroke-width': width || 1, 'stroke-dasharray': dash || 'none' });
}
function drawText(x, y, str, anchor) {
  const t = make('text', { x, y, 'text-anchor': anchor || 'start' });
  t.textContent = str;
  return t;
}
How to add it to your website
- Download the file. Click Download HTML file above. You get one file called parallel-coordinates.html with everything inside.
- Change the data. Open the file in any code editor and find the DATA list near the bottom. Replace the names and numbers with your own.
- Change the colors and text. Colors are at the top of the style tag. The title, subtitle and main point are plain HTML near the top of the body.
- Put it online. Upload the file to any host, such as GitHub Pages, Netlify or your own server, or paste it into your site. There is no build step.
Questions people ask
What is a parallel coordinates chart?
It is a chart with several vertical axes side by side, one per measure. Each item is drawn as a line that crosses every axis at its value.
What is brushing in parallel coordinates?
Brushing means dragging along an axis to select a range. Only items inside all selected ranges stay highlighted, which makes it a powerful filter.
How many lines can a parallel coordinates chart show?
Hundreds, if the lines are thin and see through. Filtering is what keeps it useful with many items.
Does the order of the axes matter?
Yes. Patterns between two measures are easiest to see when their axes sit next to each other. Put related measures side by side.
More relationships
041. Scatter Plot
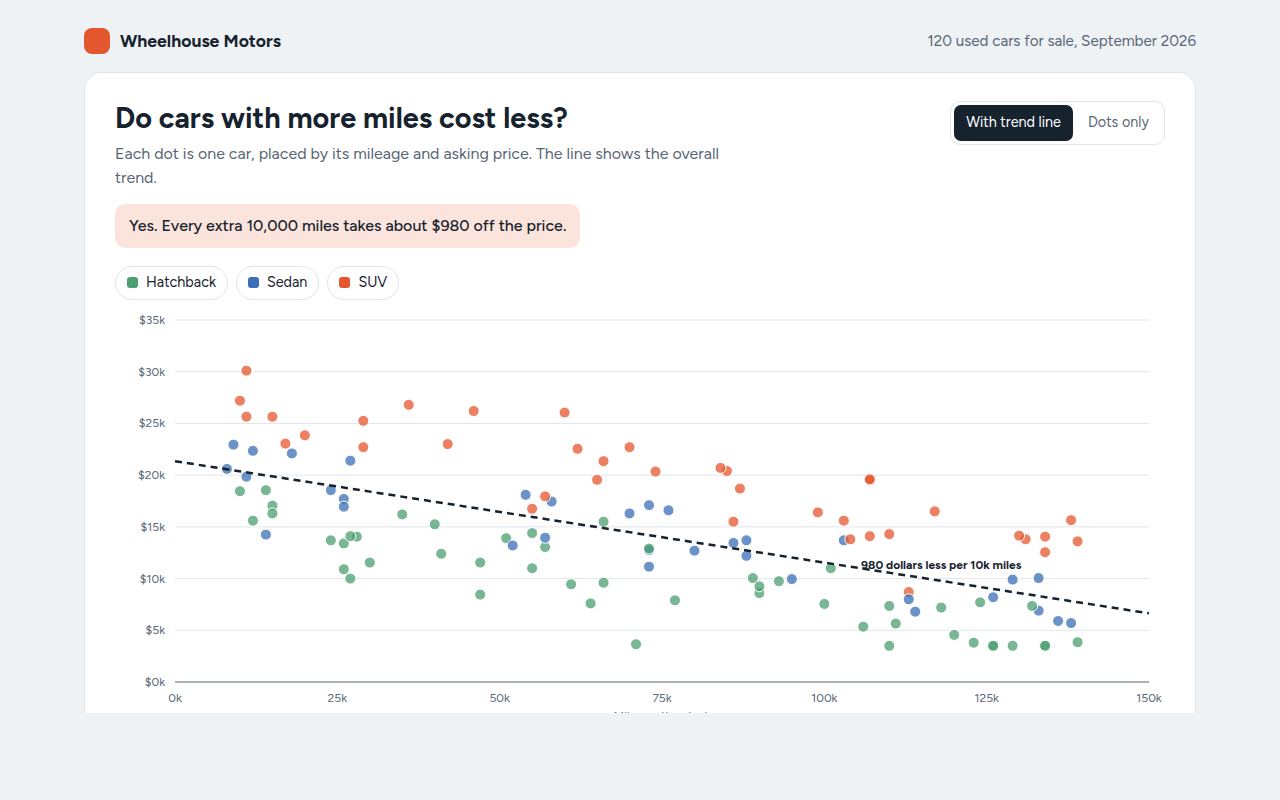
Example: used car prices against mileage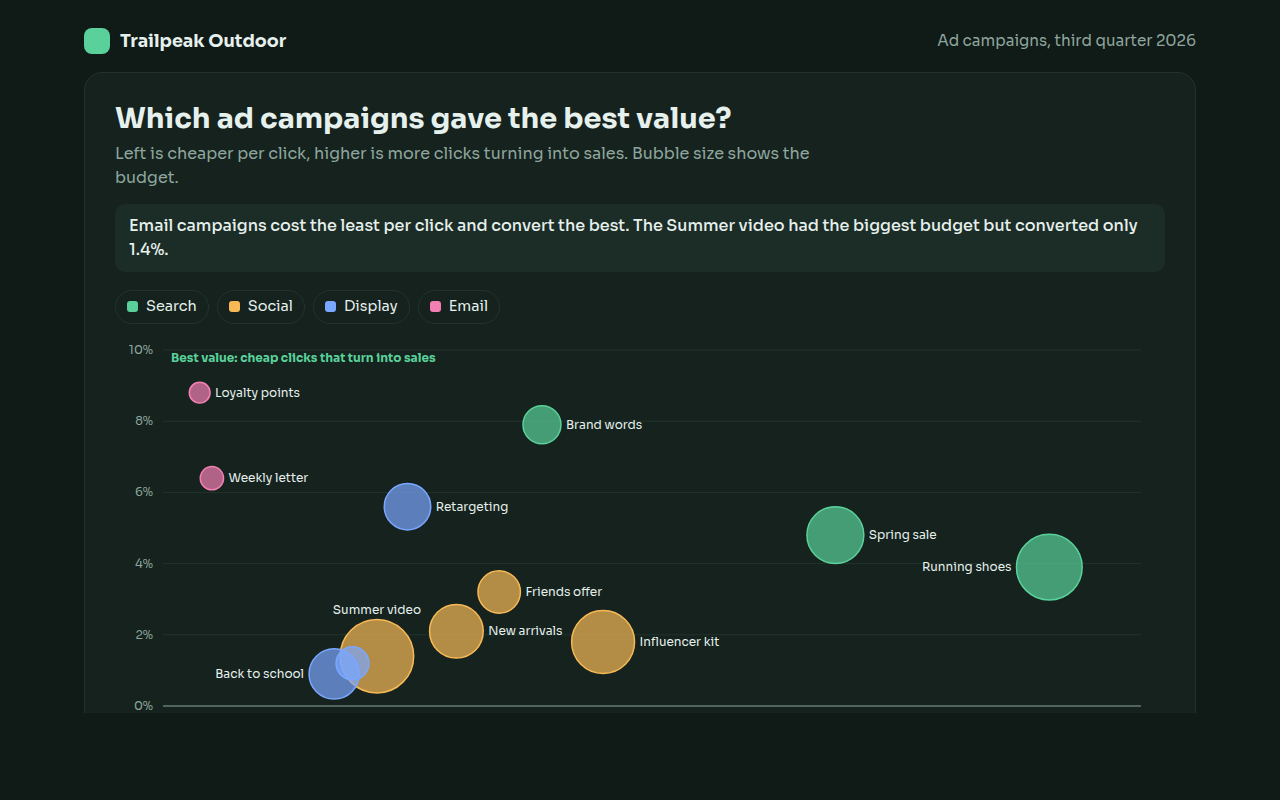
042. Bubble Chart
Example: ad campaigns compared on cost, conversion and budget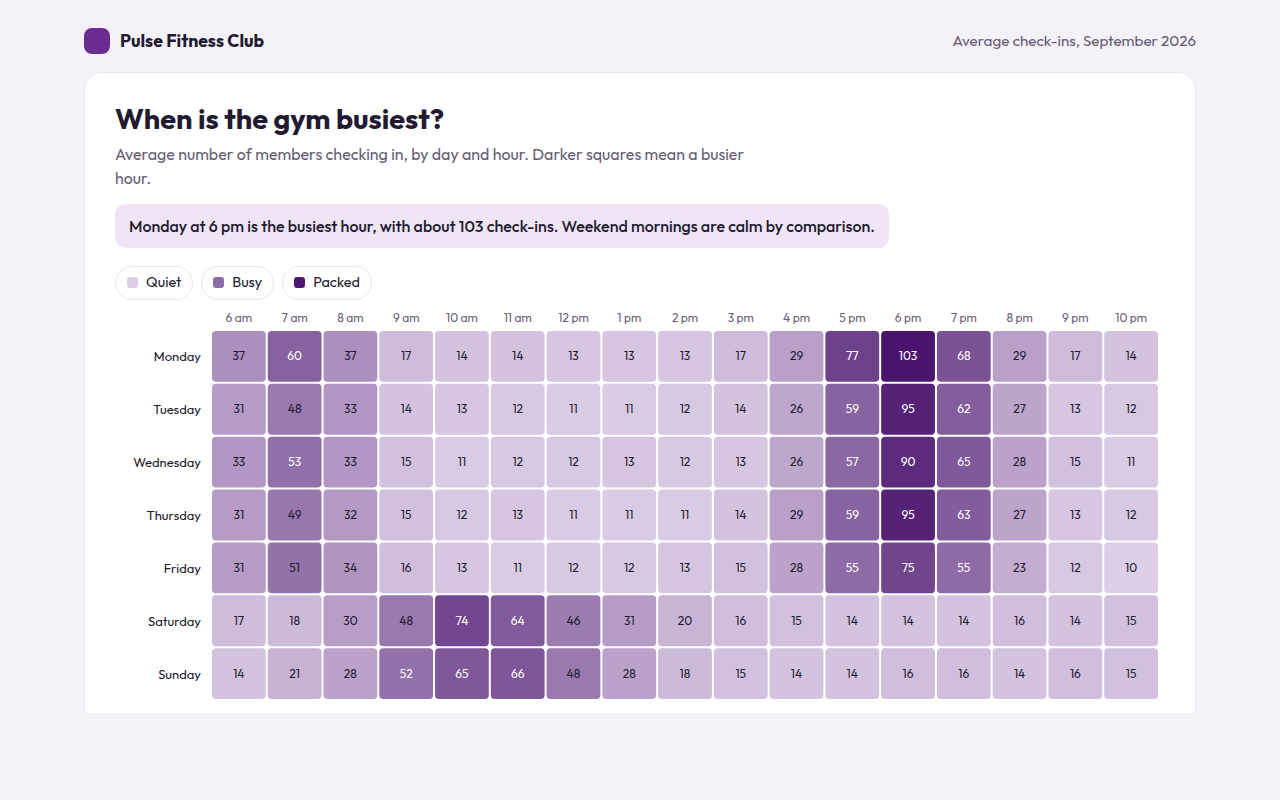
043. Heatmap
Example: gym check-ins by day and hour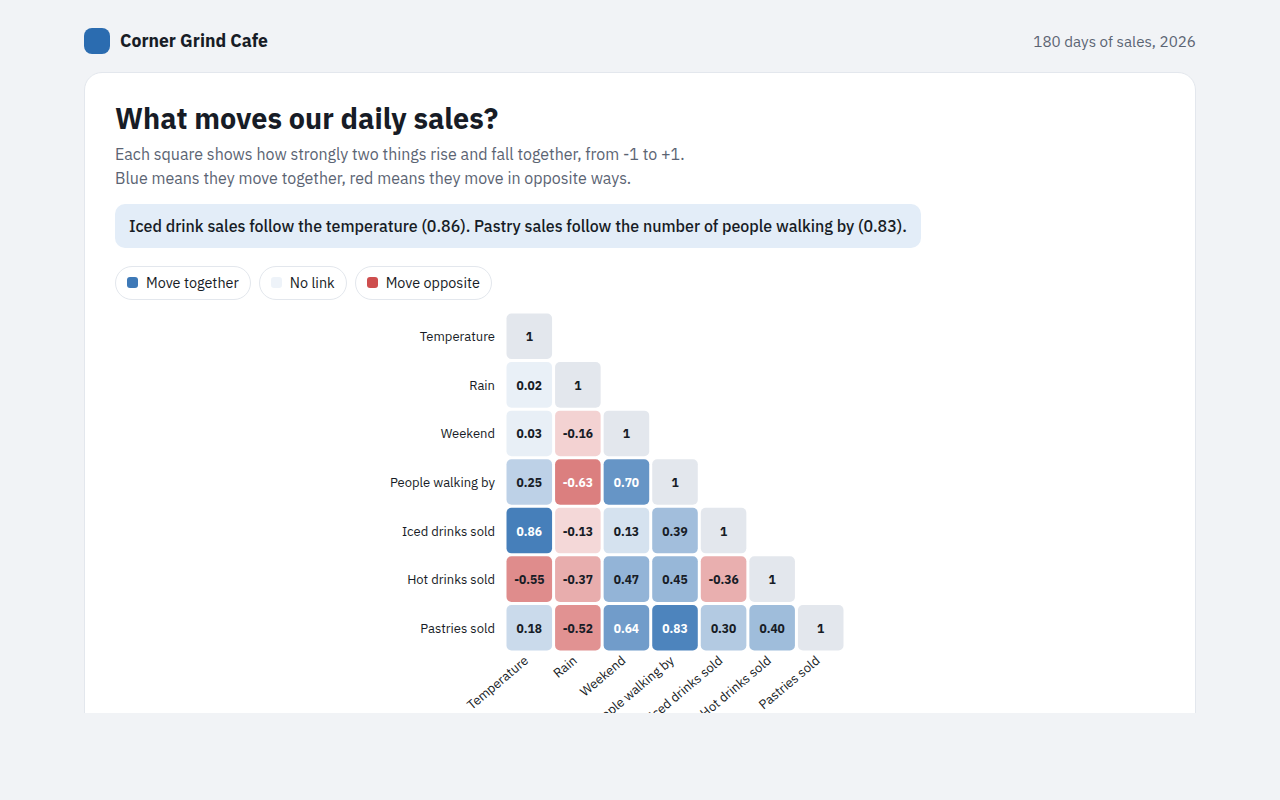
044. Correlation Matrix
Example: what drives daily sales at a cafe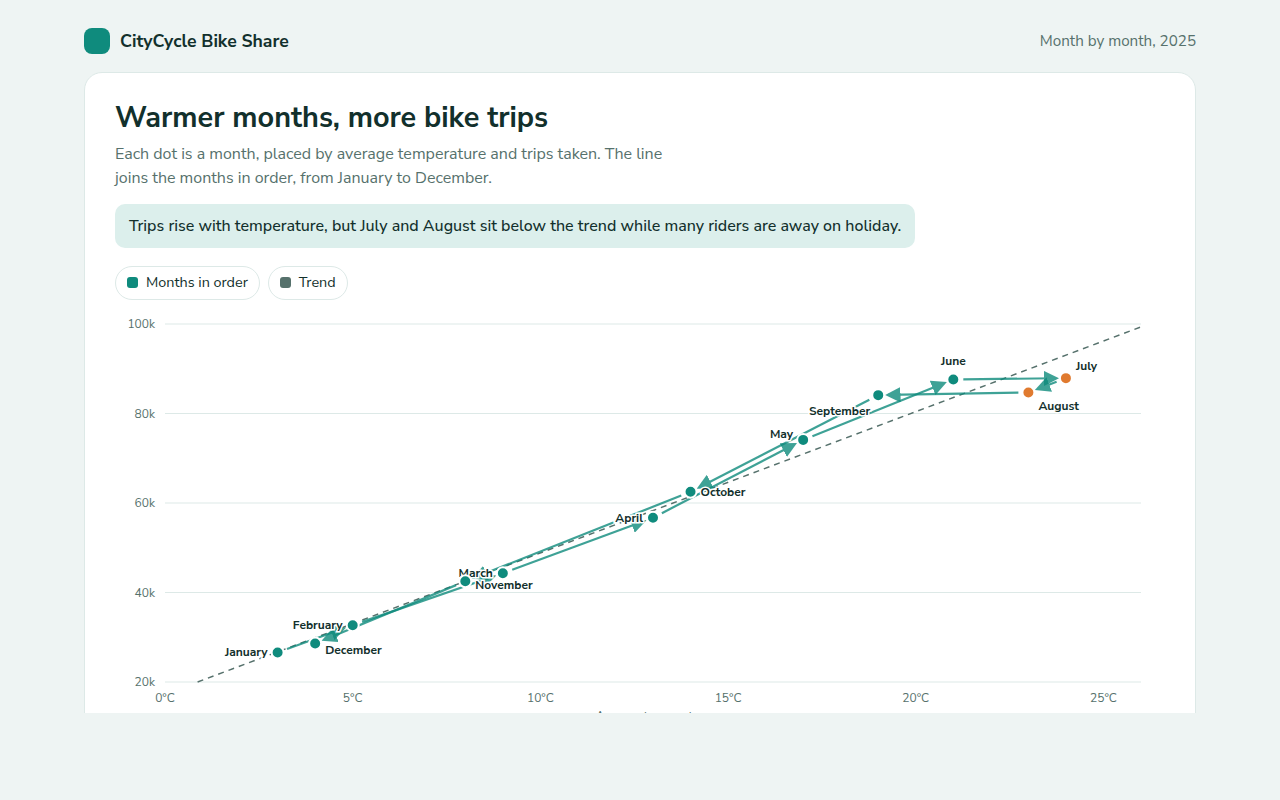
045. Connected Scatter Plot
Example: monthly bike share trips against average temperature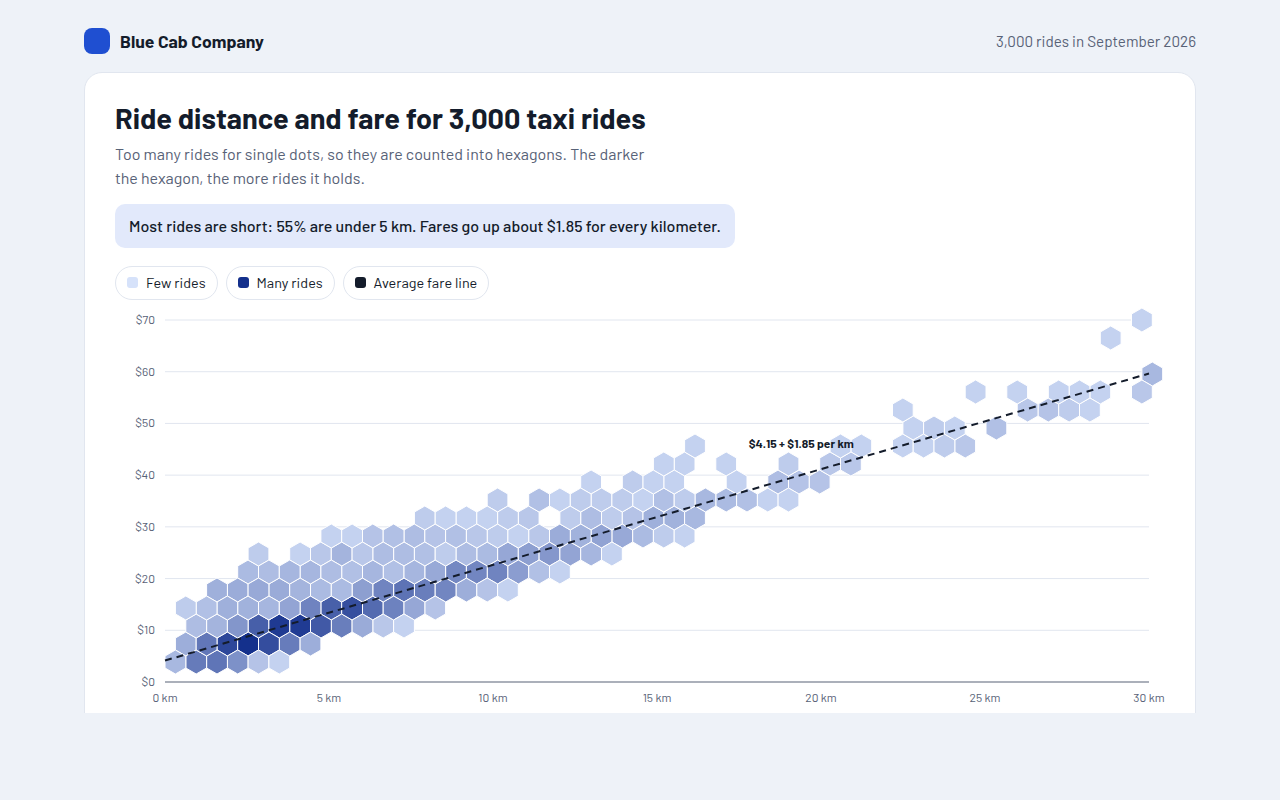
046. Hexbin Plot
Example: distance and fare for 3,000 taxi rides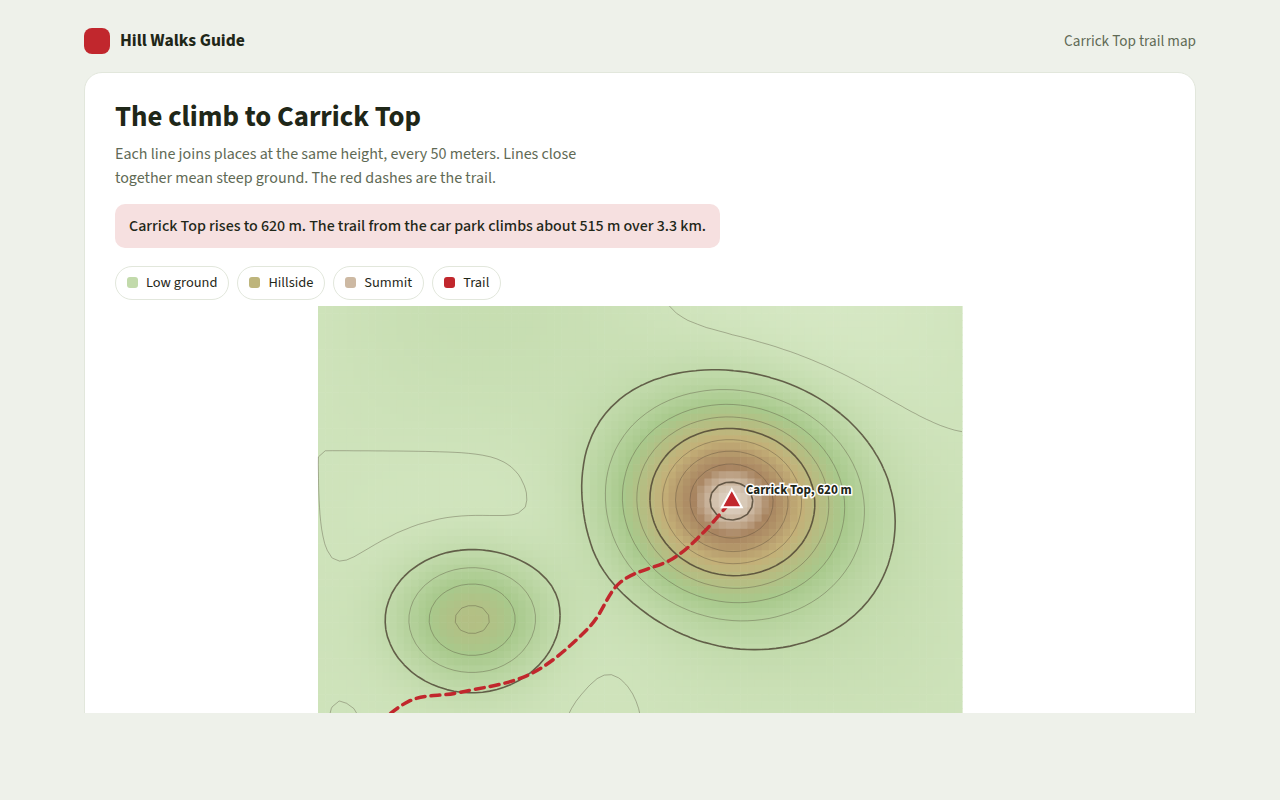
047. Contour Plot
Example: a hill walk with height lines and a trail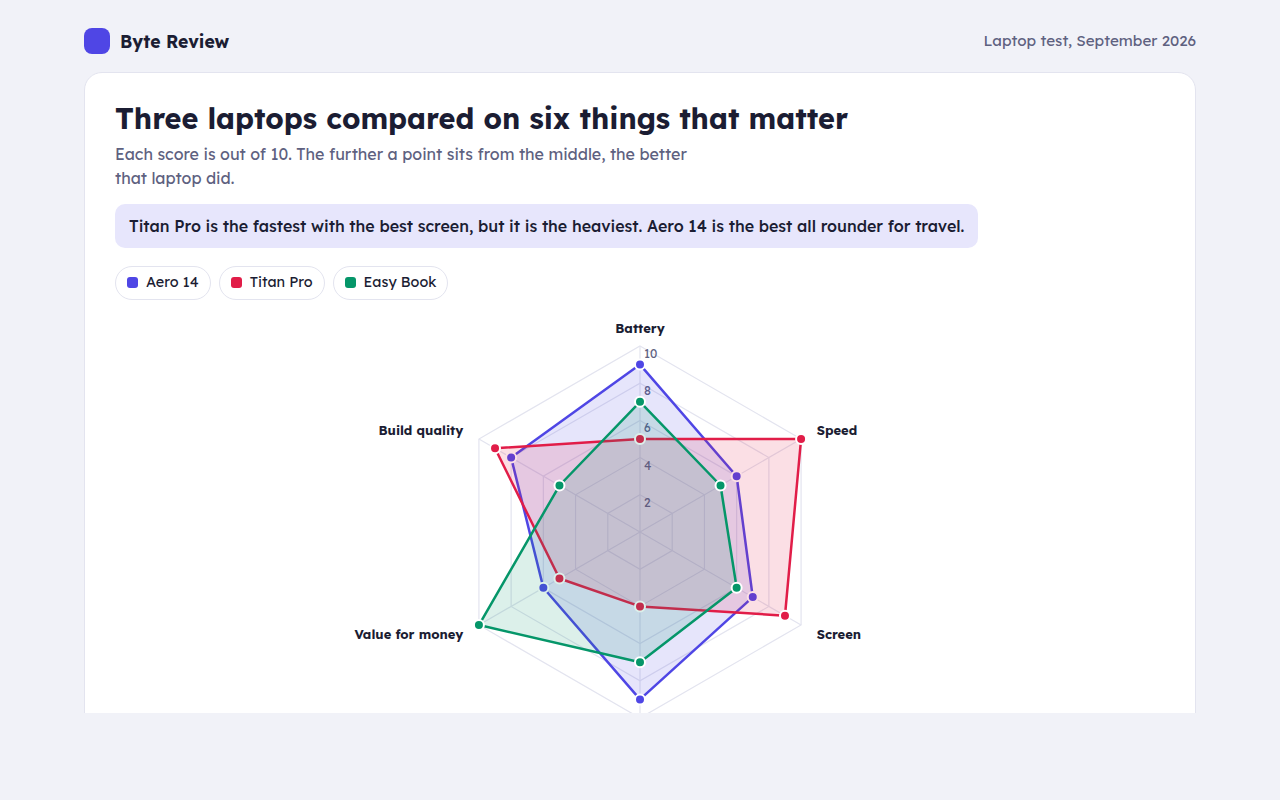
048. Radar Chart
Example: three laptops scored on six features