Home / Flow and Network / Arc Diagram
Arc Diagram in HTML, CSS and JavaScript
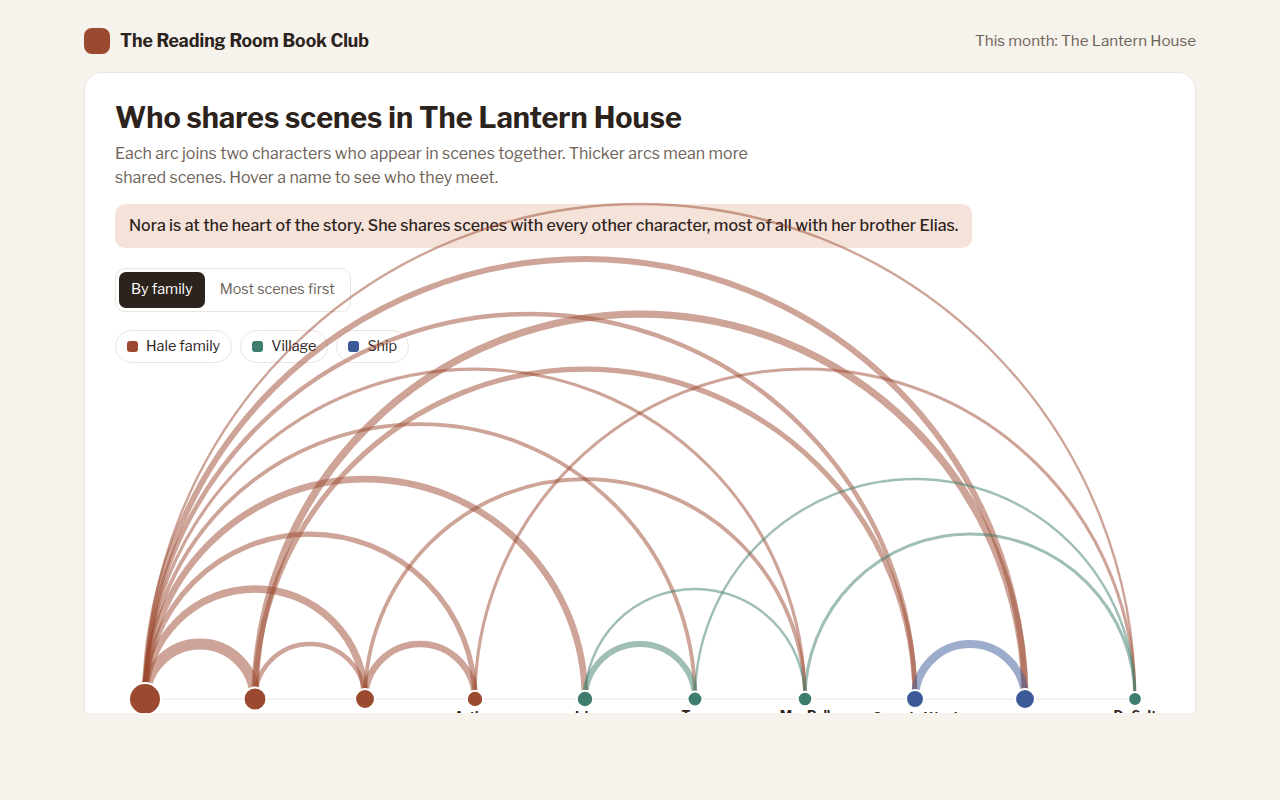
An arc diagram puts items in a row along a line and joins connected items with curved arcs above it. This free template draws one with plain SVG and vanilla JavaScript, no chart library. The example shows characters who share scenes in a novel.
What is a arc diagram?
An arc diagram puts items in a row along a line and joins connected items with curved arcs above it. Thicker arcs mean stronger links, and bigger dots mean items with more connections.
It is a tidy way to show a network when the order of the items matters, like characters grouped by family. Because every item sits on one line, labels never collide the way they can in a tangled network graph.
At a glance
- Best for
- Small networks where order or grouping matters
- Data you need
- A list of items and a list of links with strengths
- Skip it when
- Large networks with hundreds of links.
- Made with
- HTML, CSS and vanilla JavaScript. No library.
When to use a arc diagram
- Characters in a book, play or film
- Songs or chapters that share themes
- Teams that work together
- Stations or stops with direct links
When to pick another chart
- Network Graph: you want the clusters to form on their own
- Chord Diagram: you have flows with a direction and amount
What you get in this template
- Arcs drawn with SVG arc paths above a single line
- Arc width by number of shared scenes, dot size by total scenes
- Arcs draw themselves on load
- Hover a character to light up only their arcs
- Sort by family or by most scenes
- Tilted names on phones and a data table
How the code works
Here is a short version of the idea behind this arc diagram. The full file adds the axis, labels, tooltips, sorting and resizing on top of it.
const people = ['Nora', 'Elias', 'Ruth', 'Iris', 'Tom'];
const links = [[0, 1, 14], [0, 2, 9], [0, 3, 8], [3, 4, 7], [1, 2, 5]];
const x = i => 60 + i * 120, base = 260;

links.forEach(([a, b, n]) => {
  const r = (x(b) - x(a)) / 2;
  make('path', { d: 'M' + x(a) + ',' + base + 'A' + r + ',' + r + ' 0 0 1 ' + x(b) + ',' + base, fill: 'none', stroke: '#9c4a2f', 'stroke-width': 1 + n * 0.7, 'stroke-opacity': 0.5 });
});
people.forEach((p, i) => { drawCircle(x(i), base, 8, '#9c4a2f'); drawText(x(i), base + 26, p, 'middle'); });
The example uses four tiny helpers that create SVG shapes. Put them above the code and it runs as is.
const svg = document.querySelector('svg');
function make(tag, attrs) {
  const n = document.createElementNS('http://www.w3.org/2000/svg', tag);
  for (const k in attrs) n.setAttribute(k, attrs[k]);
  svg.appendChild(n);
  return n;
}
function drawRect(x, y, width, height, fill) { return make('rect', { x, y, width, height, fill }); }
function drawCircle(cx, cy, r, fill) { return make('circle', { cx, cy, r, fill }); }
function drawLine(x1, y1, x2, y2, stroke, width, dash) {
  return make('line', { x1, y1, x2, y2, stroke, 'stroke-width': width || 1, 'stroke-dasharray': dash || 'none' });
}
function drawText(x, y, str, anchor) {
  const t = make('text', { x, y, 'text-anchor': anchor || 'start' });
  t.textContent = str;
  return t;
}
How to add it to your website
- Download the file. Click Download HTML file above. You get one file called arc-diagram.html with everything inside.
- Change the data. Open the file in any code editor and find the DATA list near the bottom. Replace the names and numbers with your own.
- Change the colors and text. Colors are at the top of the style tag. The title, subtitle and main point are plain HTML near the top of the body.
- Put it online. Upload the file to any host, such as GitHub Pages, Netlify or your own server, or paste it into your site. There is no build step.
Questions people ask
What is an arc diagram?
An arc diagram places items along a line and draws arcs between items that are connected. It is a simple way to show a network.
When should I use an arc diagram instead of a network graph?
Use an arc diagram when the order of items matters or when you want neat, readable labels. Use a network graph when you want groups to form naturally.
Does the order of items matter?
Yes. Putting related items next to each other gives short arcs and a cleaner picture. This template lets you sort by family or by number of scenes.
How many items can an arc diagram show?
Up to about 30 is comfortable. With more, the arcs overlap into a solid shape.
More flow and network
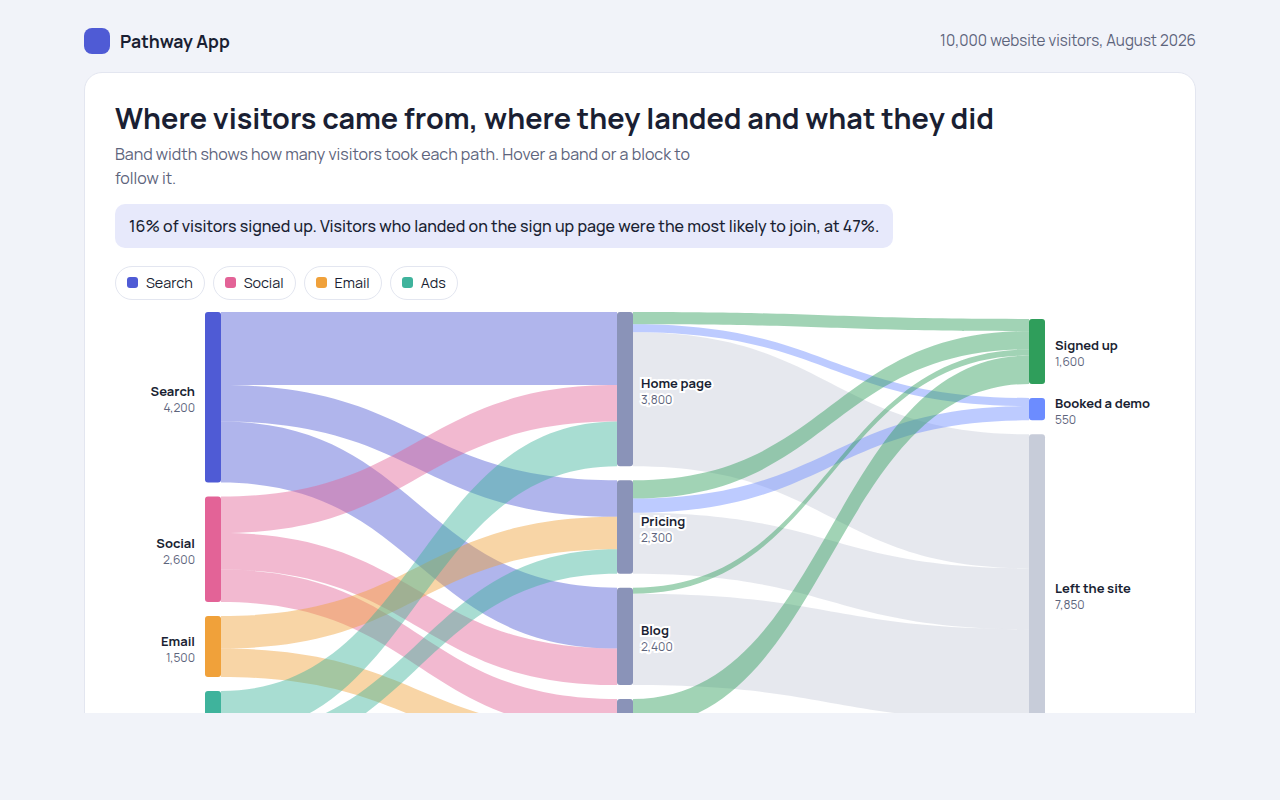
051. Sankey Diagram
Example: website visitors from source to landing page to outcome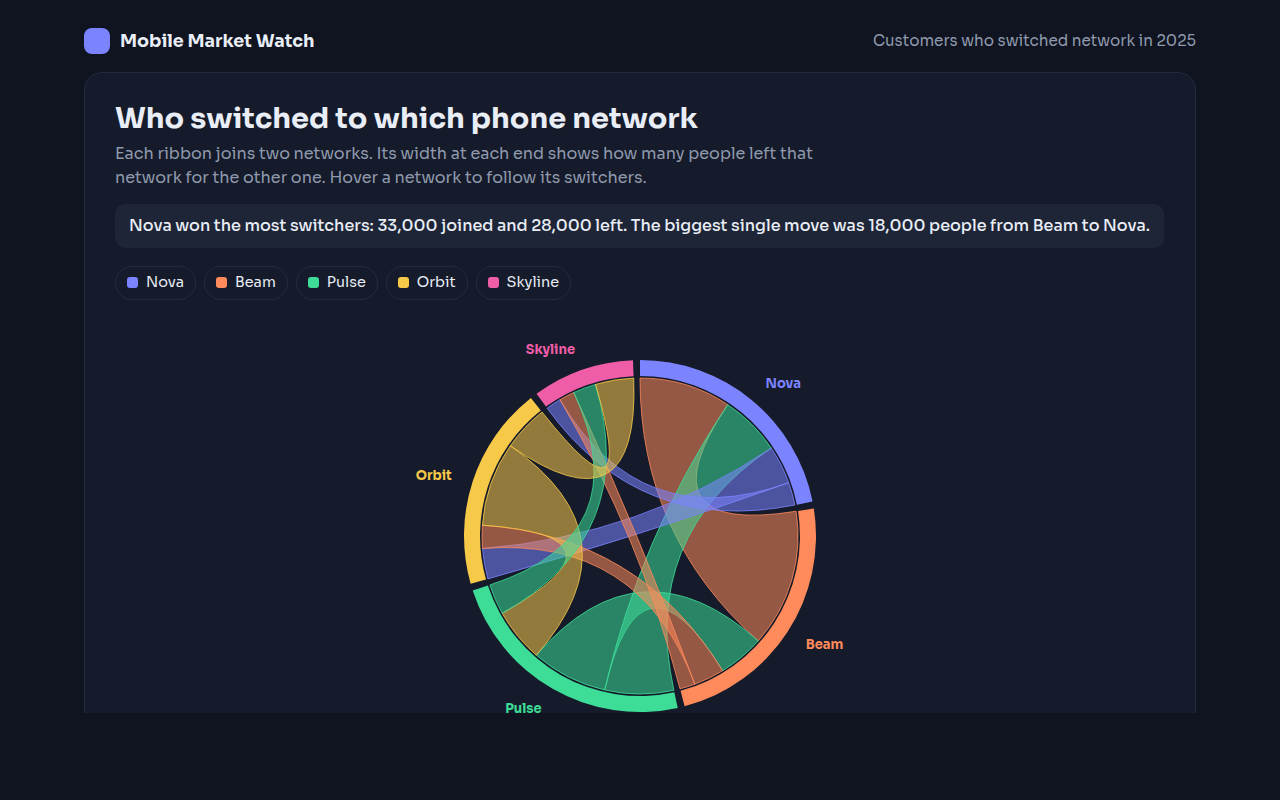
052. Chord Diagram
Example: customers switching between five phone networks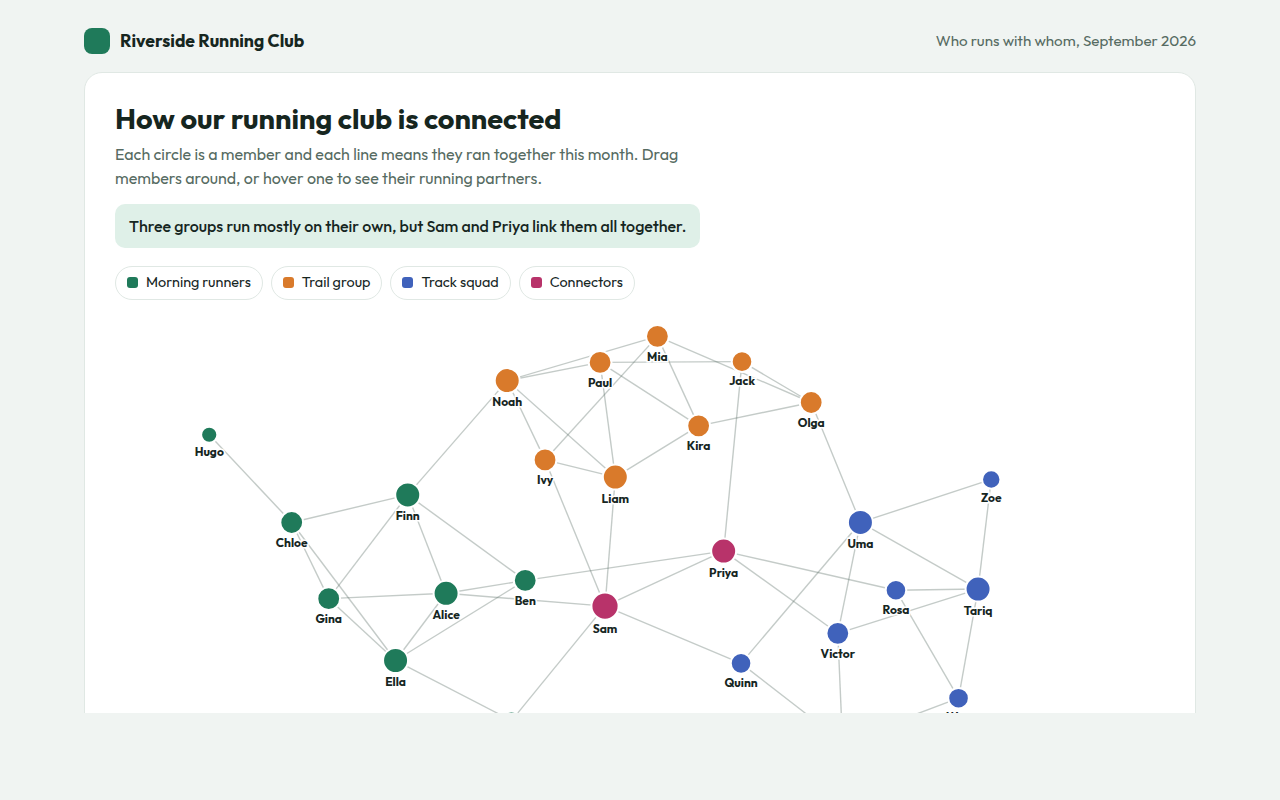
054. Network Graph
Example: who runs with whom in a running club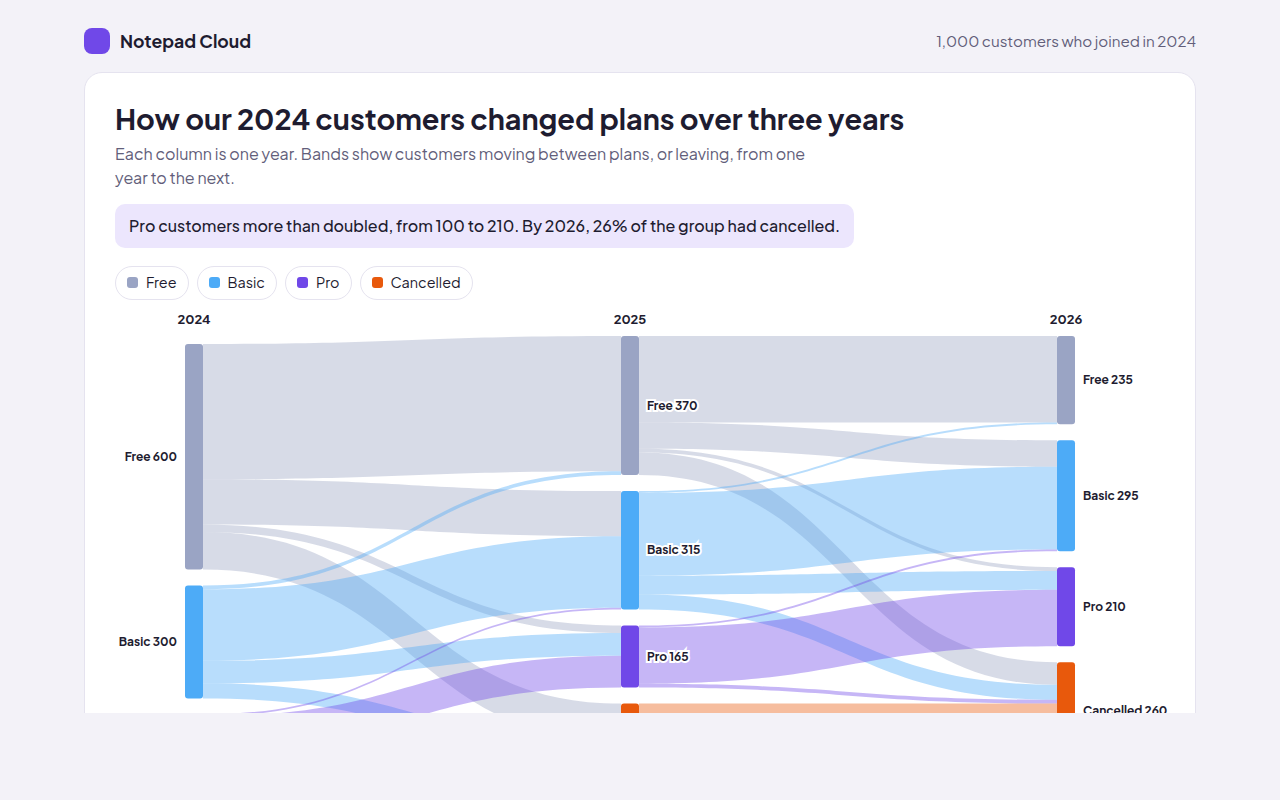
055. Alluvial Diagram
Example: customers changing plans over three years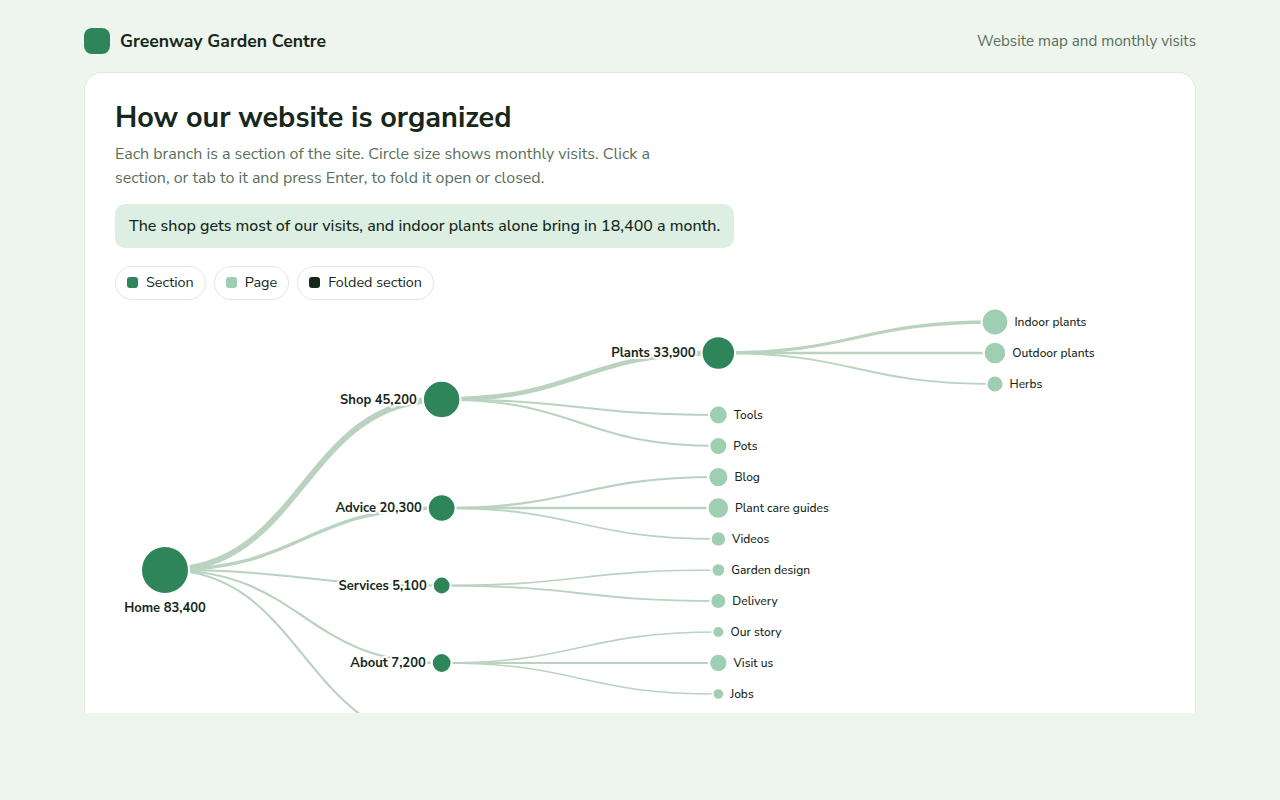
056. Tree Diagram
Example: a garden centre website map with monthly visits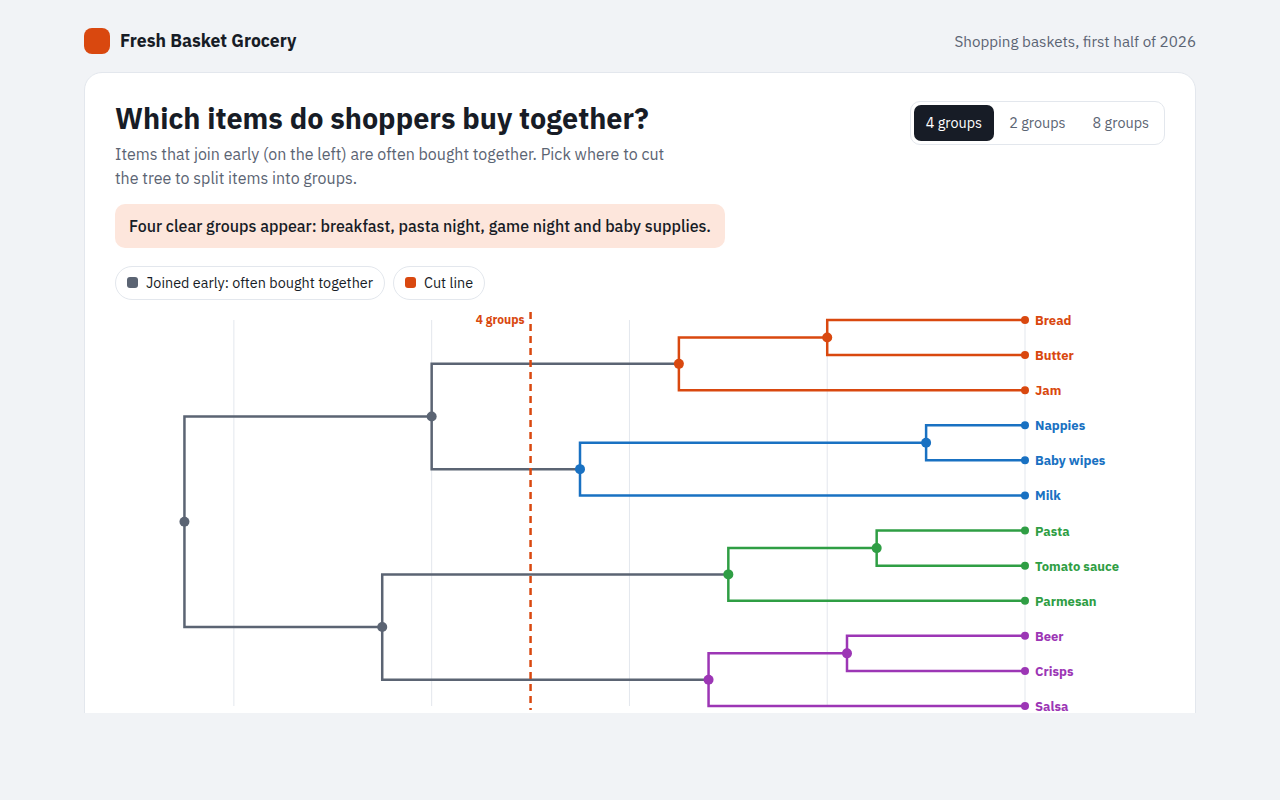
057. Dendrogram
Example: grocery items that shoppers buy together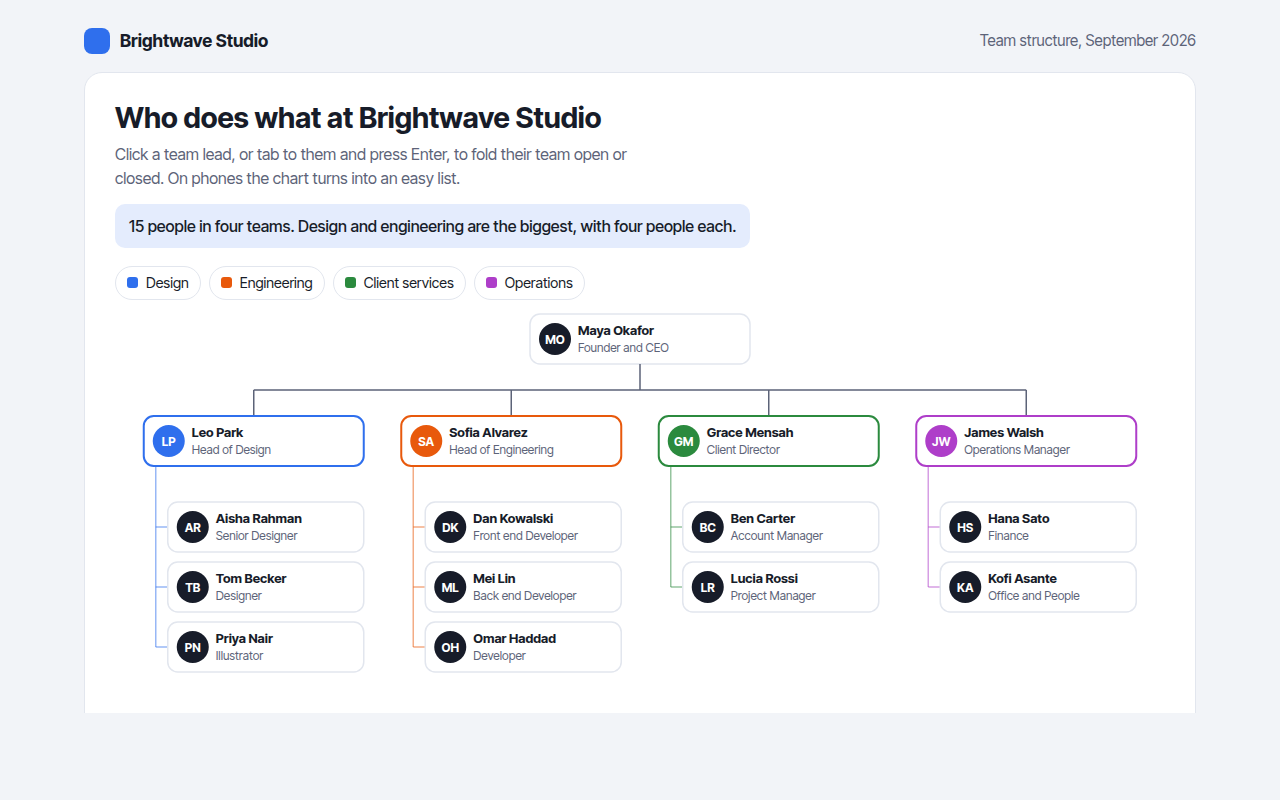
058. Org Chart
Example: the team structure of a design studio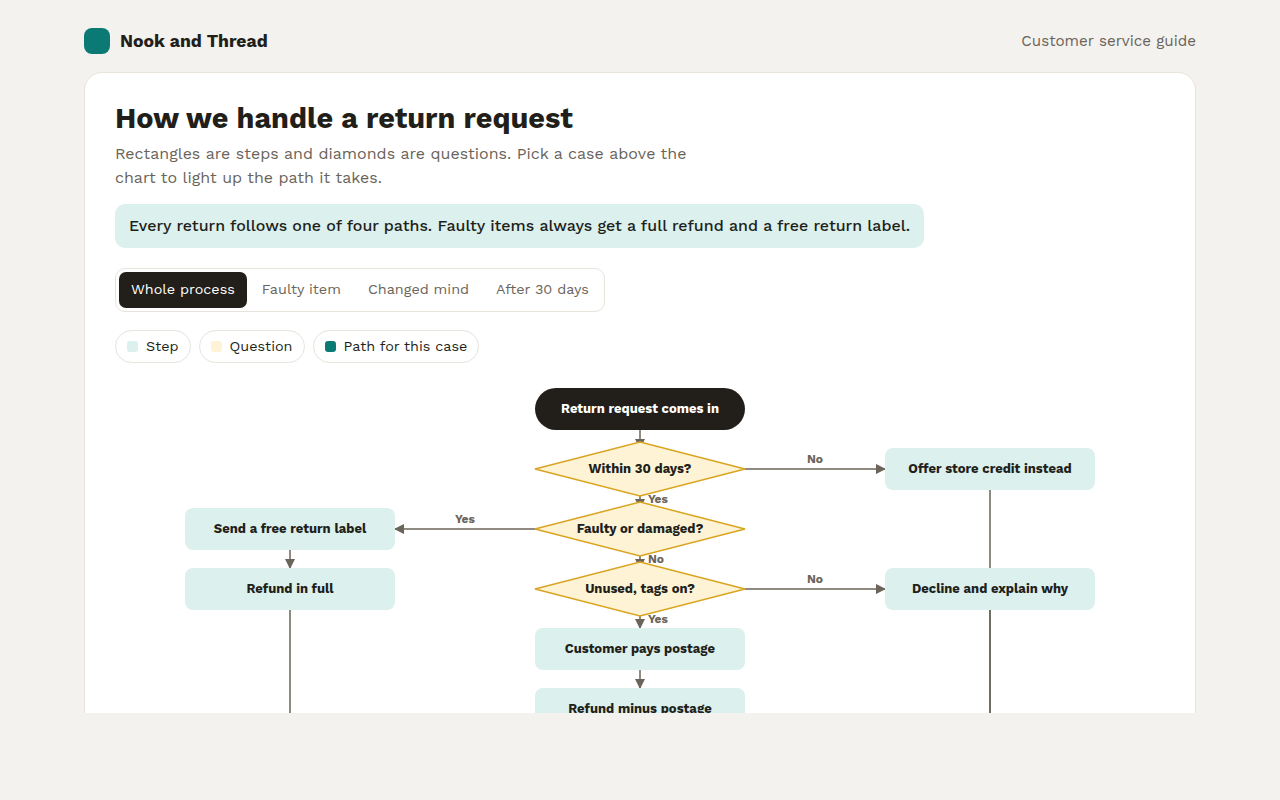
059. Flowchart
Example: how an online shop handles a return request