Home / Hardware and Performance / Performance Monitor Widget
Performance Monitor Widget in JavaScript, Free with Live Demo
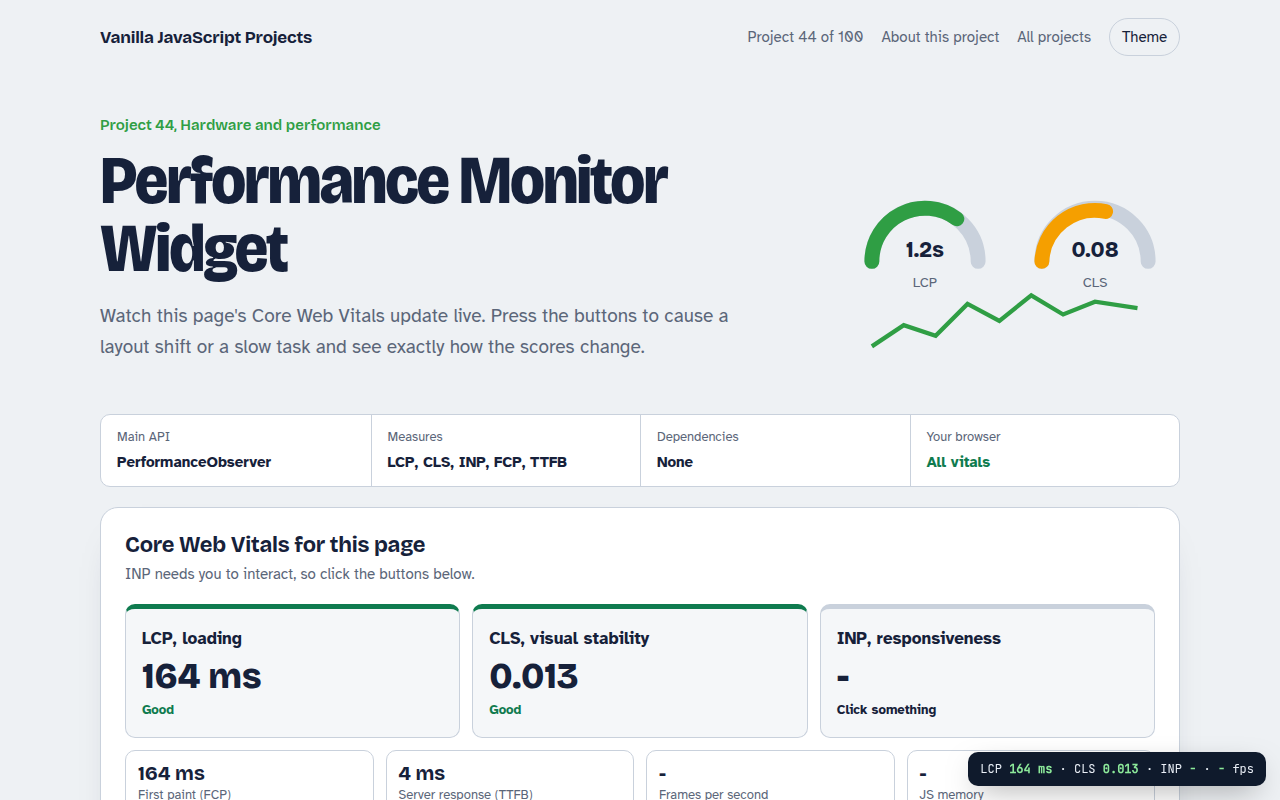
Free performance monitor in plain JavaScript. Measure LCP, CLS, INP, FCP, TTFB, long tasks and FPS live with PerformanceObserver, and trigger issues to learn.
Runs on: PerformanceObserver. All metrics: Chrome and Edge. Safari and Firefox support FCP, TTFB and LCP (Firefox and Safari 26+), with INP and CLS in the newest versions or not at all.
What is the Performance Monitor Widget?
Watch this page's Core Web Vitals update live: loading speed, layout shifts and how fast it responds to clicks. Buttons let you cause a layout shift or a slow task so you can see exactly how the scores react.
Every number comes from PerformanceObserver. CLS groups layout shifts into session windows, INP takes the slowest interaction, and each value is rated with Google's official good and poor thresholds.
Good for
- SEO and site speed audits
- Debugging slow pages
- Teaching Core Web Vitals
- Adding a speed panel to your own site
What this project does
- LCP, CLS and INP rated good, needs work or poor with Google's thresholds
- FCP, TTFB and a navigation timing waterfall
- Long tasks list with durations
- Live frames per second graph and JS memory where available
- Floating mini widget you can copy into your own site
How it works
- Observe entriesA PerformanceObserver subscribes to each entry type. buffered: true replays what happened before the script ran.
- Compute the metricCLS groups shifts into session windows. INP takes the slowest interaction. LCP takes the last large paint.
- Rate itEach value is compared with the official thresholds, for example LCP is good under 2.5 seconds.
The key JavaScript
This is the heart of the project. The full file has the rest, including the screen layout and error handling.
new PerformanceObserver((list) => {
  const last = list.getEntries().at(-1);
  report("LCP", last.startTime);                        // good under 2500 ms
}).observe({ type: "largest-contentful-paint", buffered: true });

let cls = 0;
new PerformanceObserver((list) => {
  for (const e of list.getEntries()) if (!e.hadRecentInput) cls += e.value;
  report("CLS", cls);                                   // good under 0.1
}).observe({ type: "layout-shift", buffered: true });

new PerformanceObserver((list) => {
  for (const e of list.getEntries()) if (e.interactionId) inp = Math.max(inp, e.duration);
}).observe({ type: "event", durationThreshold: 16, buffered: true });
How to use it
- Click Download HTML file above.
- Open the file in a code editor, like VS Code.
- Run it from a local server with
npx serve .so the camera, microphone and AI features are allowed. - Change the text and colors, then upload it to GitHub Pages, Netlify or your own site. It is one file with no build step.
Questions people ask
What are good Core Web Vitals scores?
LCP under 2.5 seconds, CLS under 0.1 and INP under 200 milliseconds count as good.
Why is INP empty at first?
INP measures interactions, so it needs you to click or type something first.
Can I add this to my own site?
Yes. Copy the observer code and send the values to your analytics instead of showing them.
More Hardware and Performance projects
041. Bluetooth Device Dashboard
Read live heart rate and battery from a Bluetooth device
042. Arduino Serial Monitor
Read and plot data from an Arduino or ESP32 over USB
043. WebAssembly Image Filters
Photo filters in hand written WebAssembly, raced against JavaScript
045. Browser File Compressor
Gzip any file or unpack a .gz right in the browser