Home / Content and Data / SVG Charts Kit
SVG Charts Kit in JavaScript, Free with Live Demo
Free SVG charts in plain JavaScript. Line, bar and donut charts that scale to any width, with tooltips, keyboard focus, series toggles, animation and an accessible data table.
Runs on: SVG and path math. Works in all modern browsers.
What is the SVG Charts Kit?
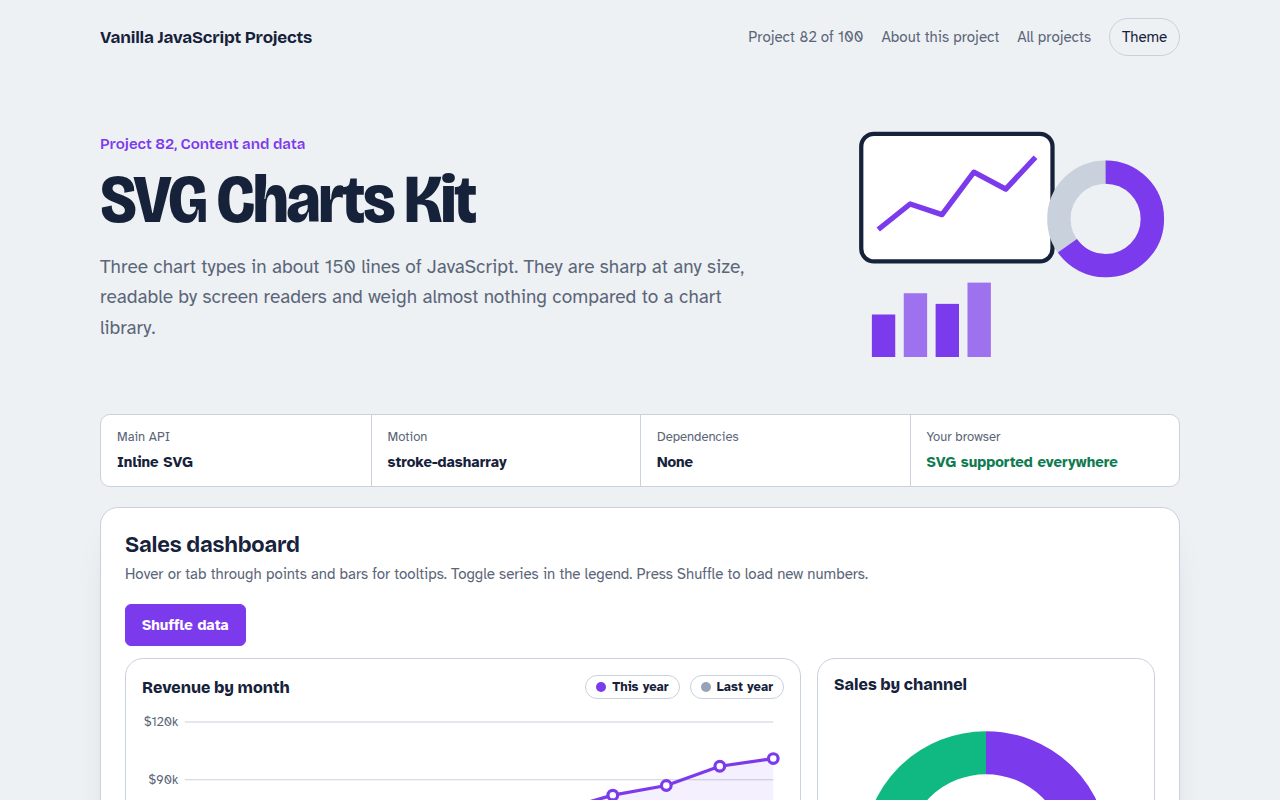
A small dashboard with three hand-made SVG charts: monthly revenue as a line chart with two series, orders by weekday as bars, and sales by channel as a donut.
Hover or tab to any point for a tooltip, switch series on and off, shuffle the data to see the charts redraw with animation, and open the data as a plain table.
Good for
- Admin dashboards
- Reports and landing page stats
- Small apps that do not want a chart library
- Learning how charts are drawn
What this project does
- Line chart with area fill and two series
- Bar chart with the best day highlighted
- Donut chart with a total in the middle
- Tooltips on hover and keyboard focus
- Legend toggles, animation and data table
How it works
- Scale data to pixelsEach chart maps values to a viewBox with two tiny functions, x(i) and y(v). The viewBox makes the chart scale to any width.
- Draw with pathsThe line is one path of M and L commands. Bars are rects. The donut uses circles with stroke-dasharray slices.
- Tooltips for mouse and keyboardEvery point is a focusable group with a label. Hover or focus shows the same tooltip, and screen readers read the label.
The key JavaScript
This is the heart of the project. The full file has the rest, including the screen layout and error handling.
const x = (i) => pad + i * (width - pad * 2) / (values.length - 1);
const y = (v) => height - pad - (v / max) * (height - pad * 2);
const d = values.map((v, i) => (i ? "L" : "M") + x(i) + " " + y(v)).join(" ");
svg.innerHTML = `<path d="${d}" fill="none" stroke="#7C3AED" stroke-width="3"/>`;

// donut slice
const len = (value / total) * 2 * Math.PI * r;
circle.setAttribute("stroke-dasharray", `${len} ${circumference - len}`);
How to use it
- Click Download HTML file above.
- Open the file in a code editor, like VS Code.
- Run it from a local server with
npx serve .so the camera, microphone and AI features are allowed. - Change the text and colors, then upload it to GitHub Pages, Netlify or your own site. It is one file with no build step.
Questions people ask
When should I use a chart library instead?
For zooming, huge datasets or many chart types. For a few simple charts, plain SVG is lighter and easier to style.
Are SVG charts accessible?
They can be. Here every point has a label, points are focusable and the data is also available as a table.
How do I use my own data?
Replace the generated arrays with numbers from your API and call the draw functions again.
More Content and Data projects
081. Data Table
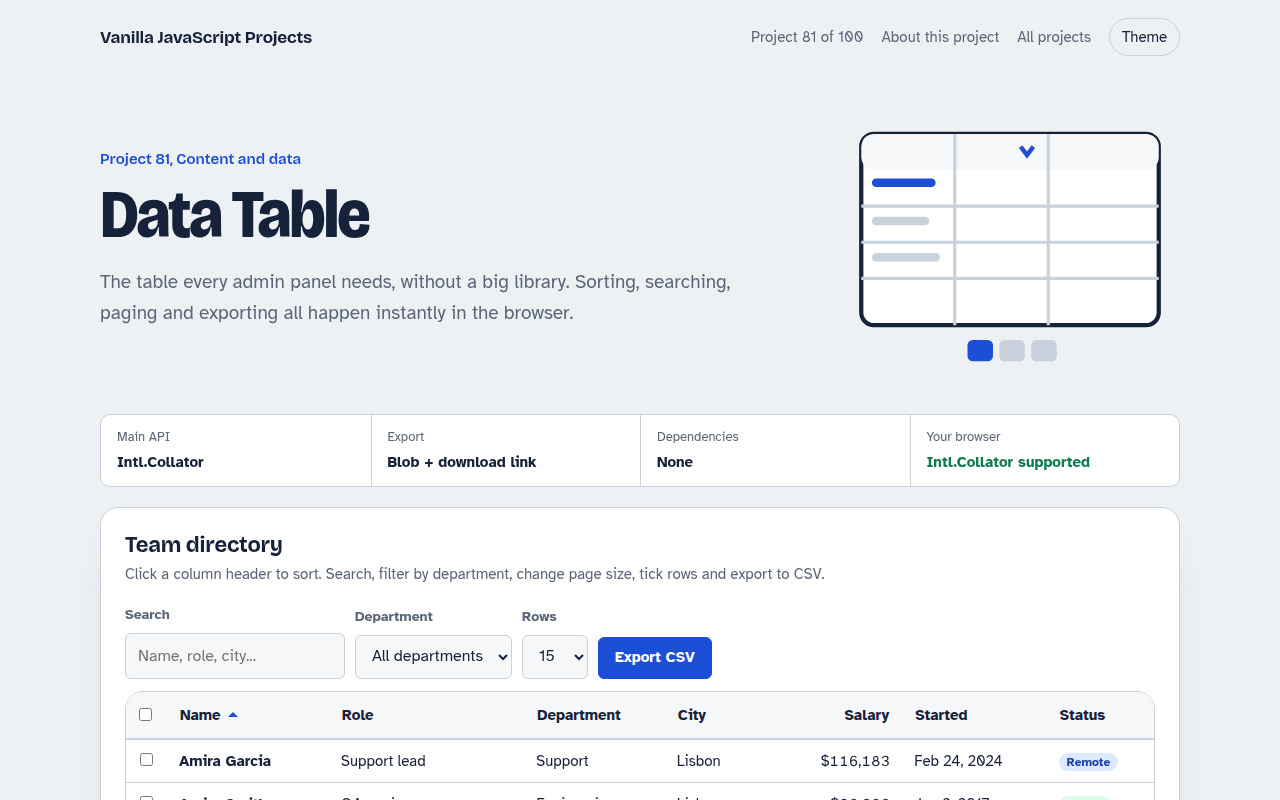
A sortable, searchable table with filters, pages, row selection and CSV export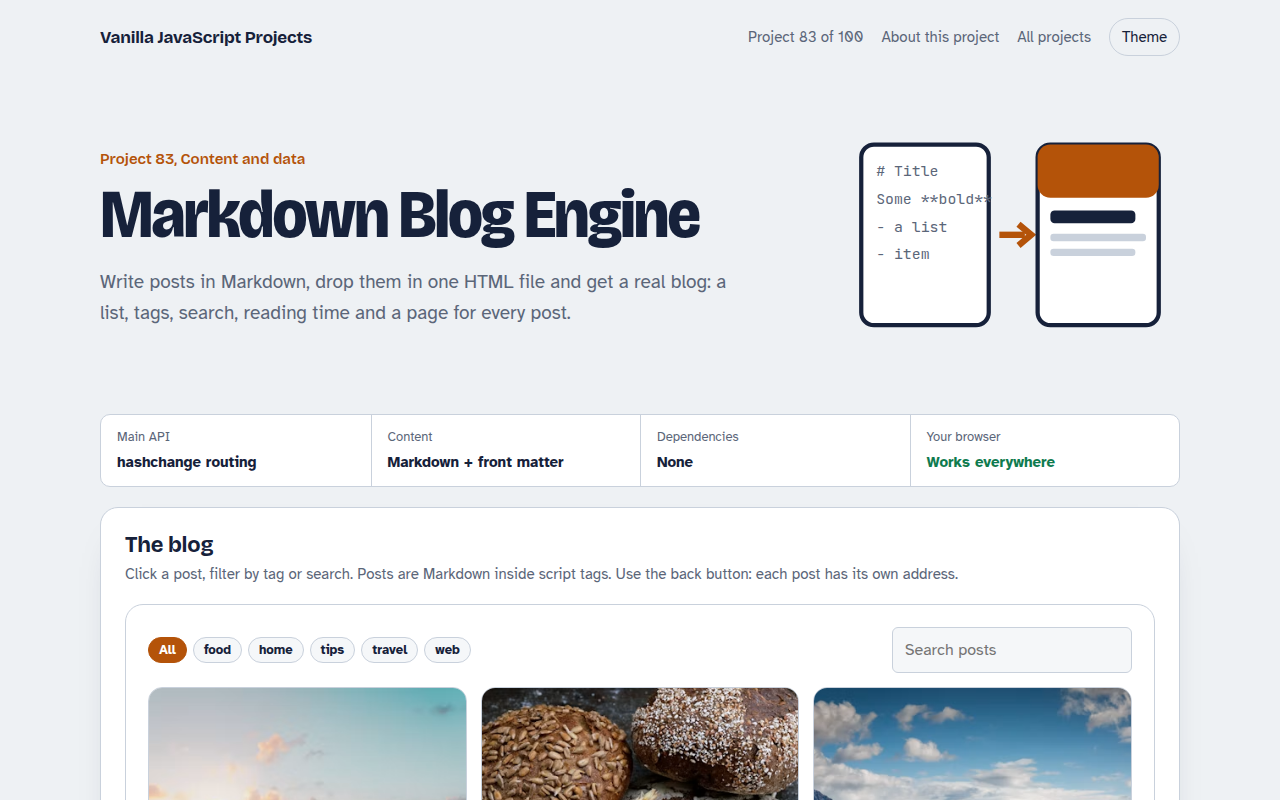
083. Markdown Blog Engine
A tiny blog that reads Markdown posts, with tags, search and reading time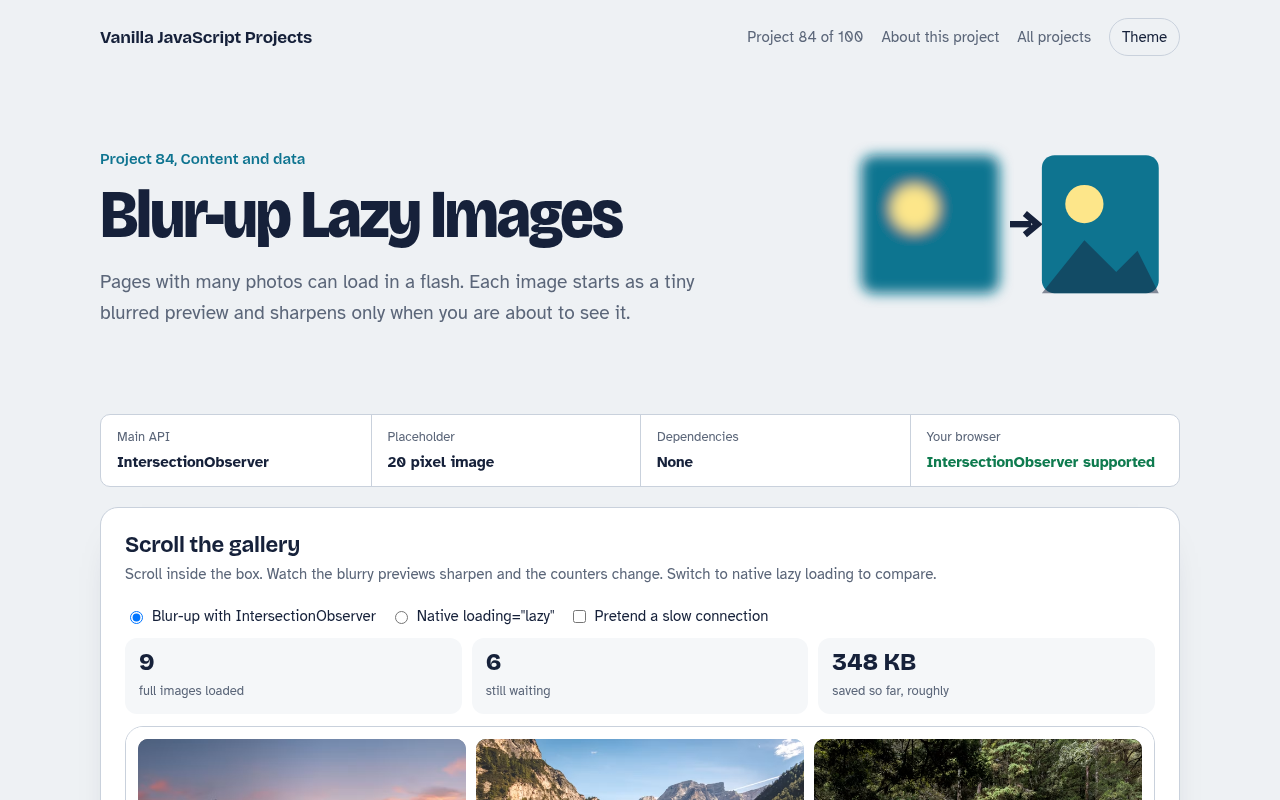
084. Blur-up Lazy Images
A photo grid that shows tiny blurred placeholders and loads full images when they scroll into view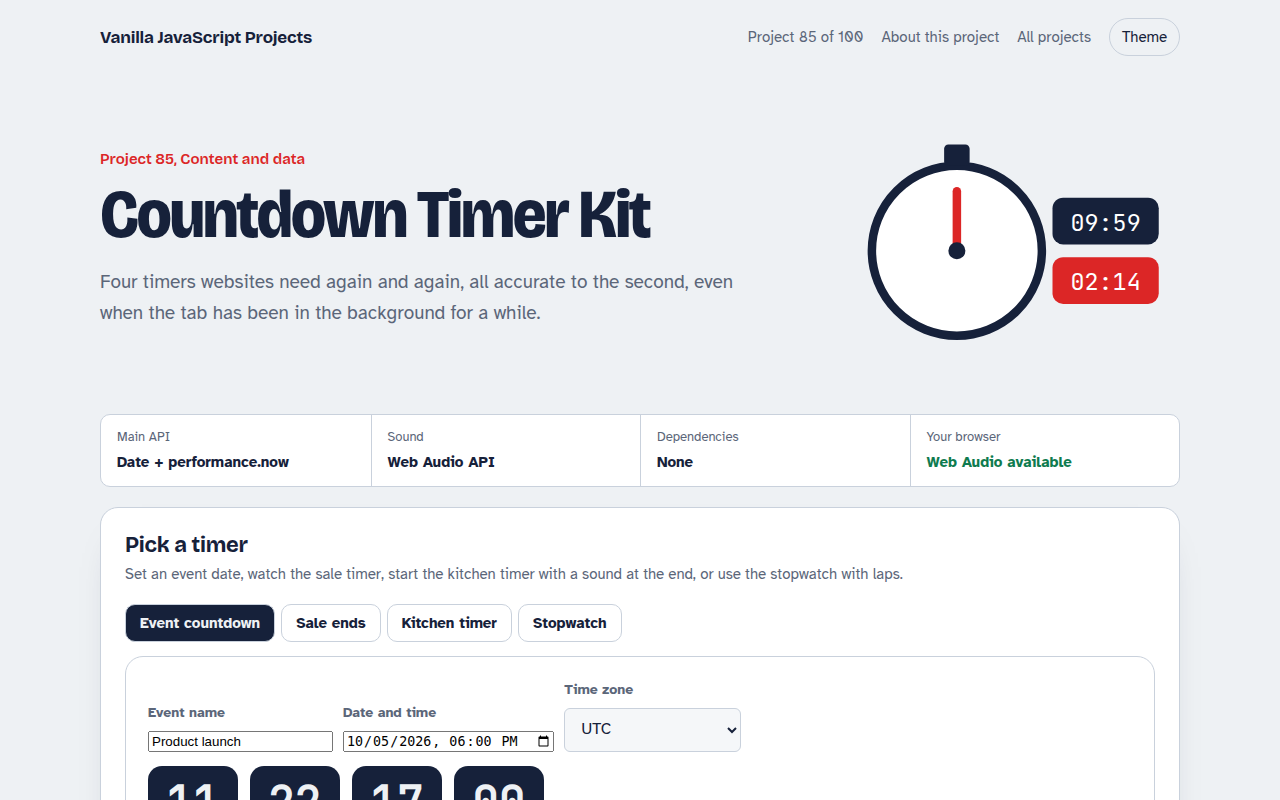
085. Countdown Timer Kit
An event countdown, a sale timer, a kitchen timer with sound and a stopwatch with laps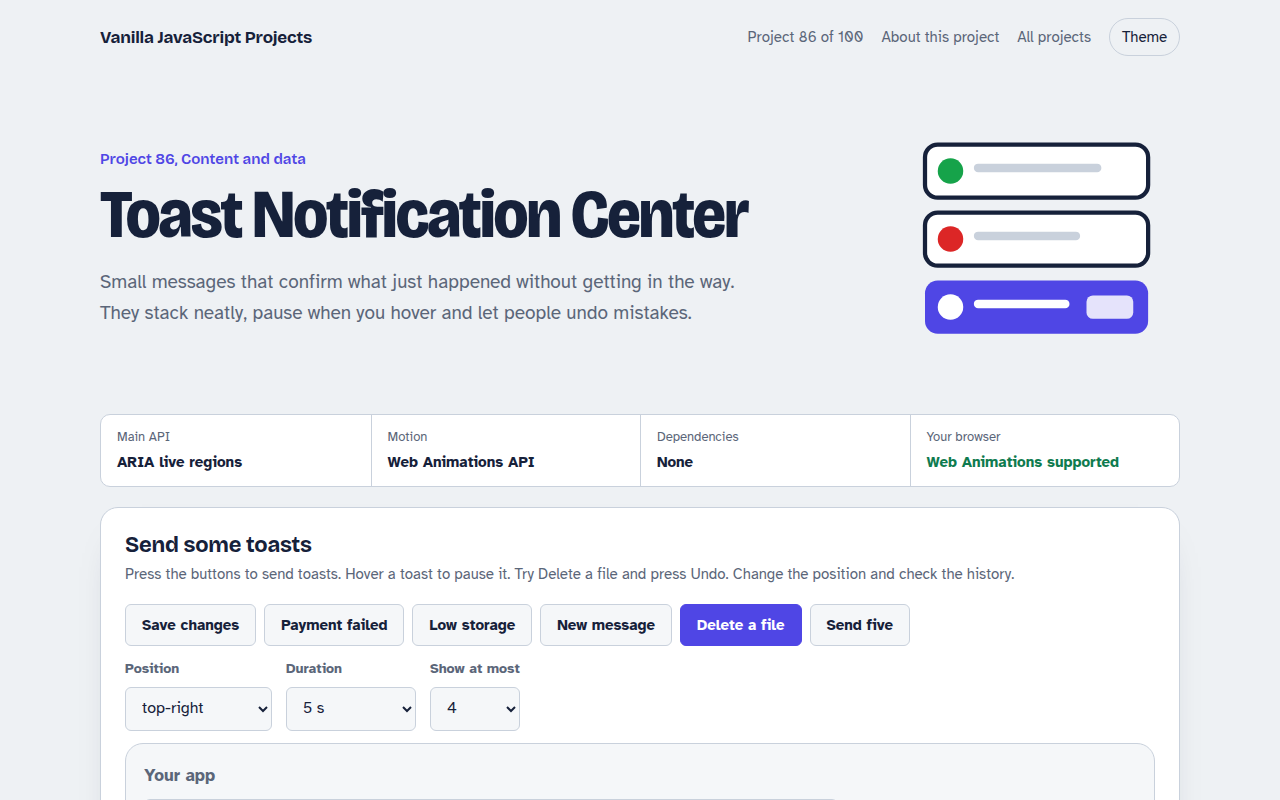
086. Toast Notification Center
Toast messages with types, positions, undo actions and a notification history