Home / Dashboard Widgets
Dashboard Widgets in HTML and JavaScript
Dashboards need more than bars and lines. These ten widgets cover the pieces people ask for most: a gauge for a score, rings for daily goals, KPI cards with trend lines, a year of activity, a project plan, a profit breakdown, a word cloud and more. Each one is a single HTML file with no library, ready to drop into your own dashboard.
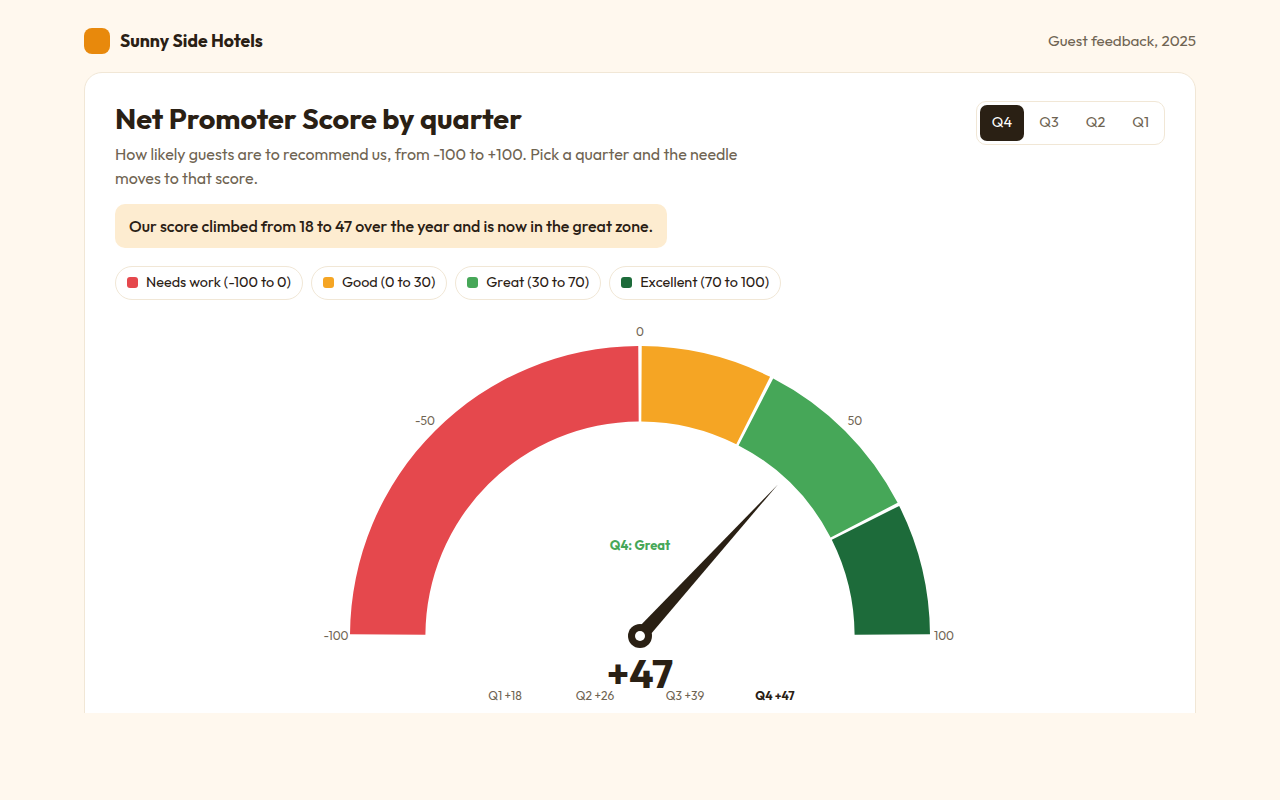
061. Gauge Chart
Example: a hotel Net Promoter Score by quarter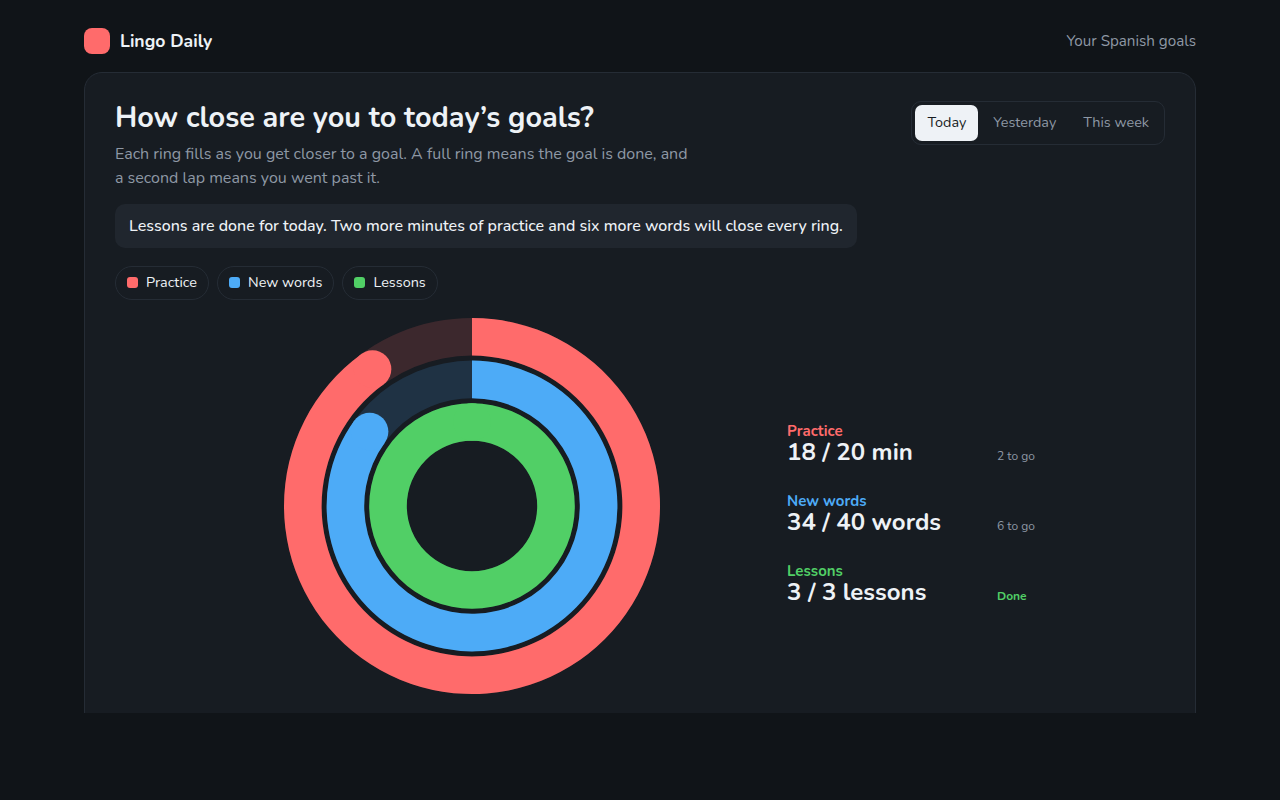
062. Progress Ring Chart
Example: daily goals in a language learning app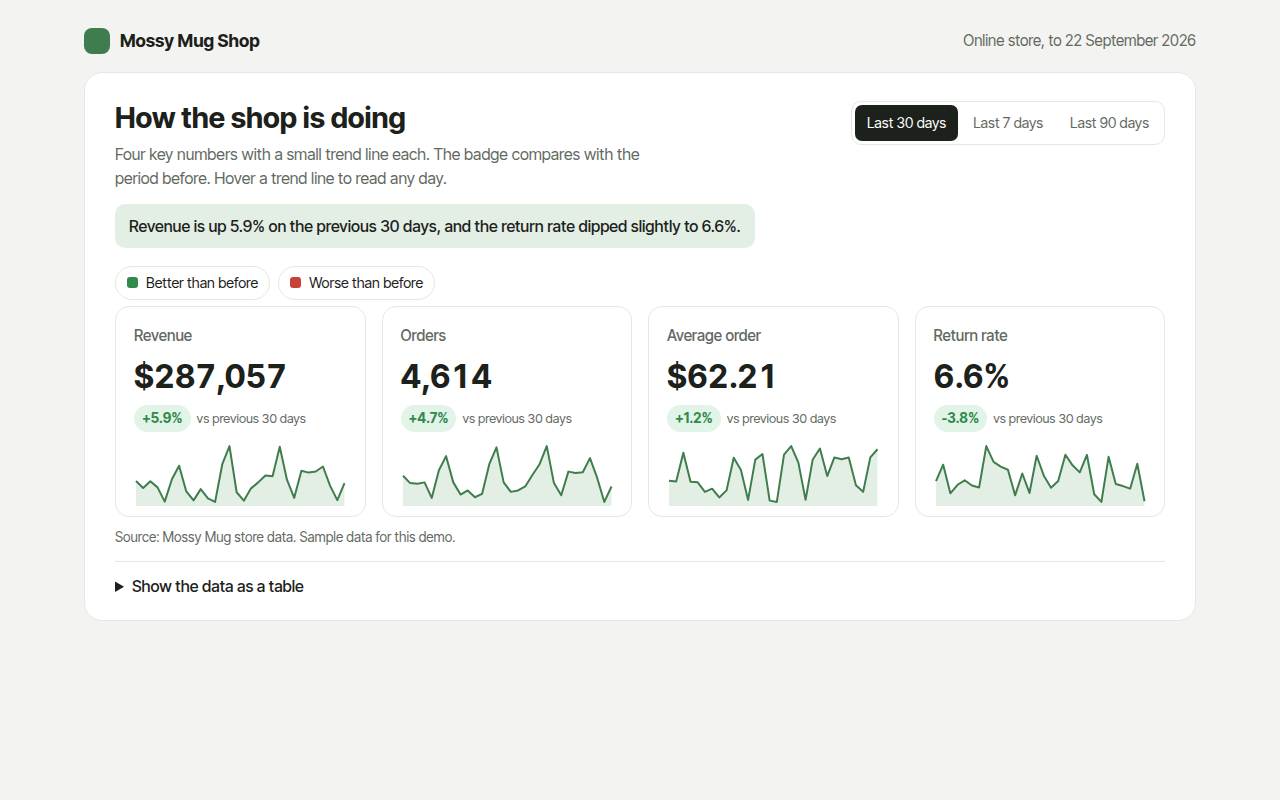
063. KPI Cards with Sparklines
Example: revenue, orders, average order and returns for an online shop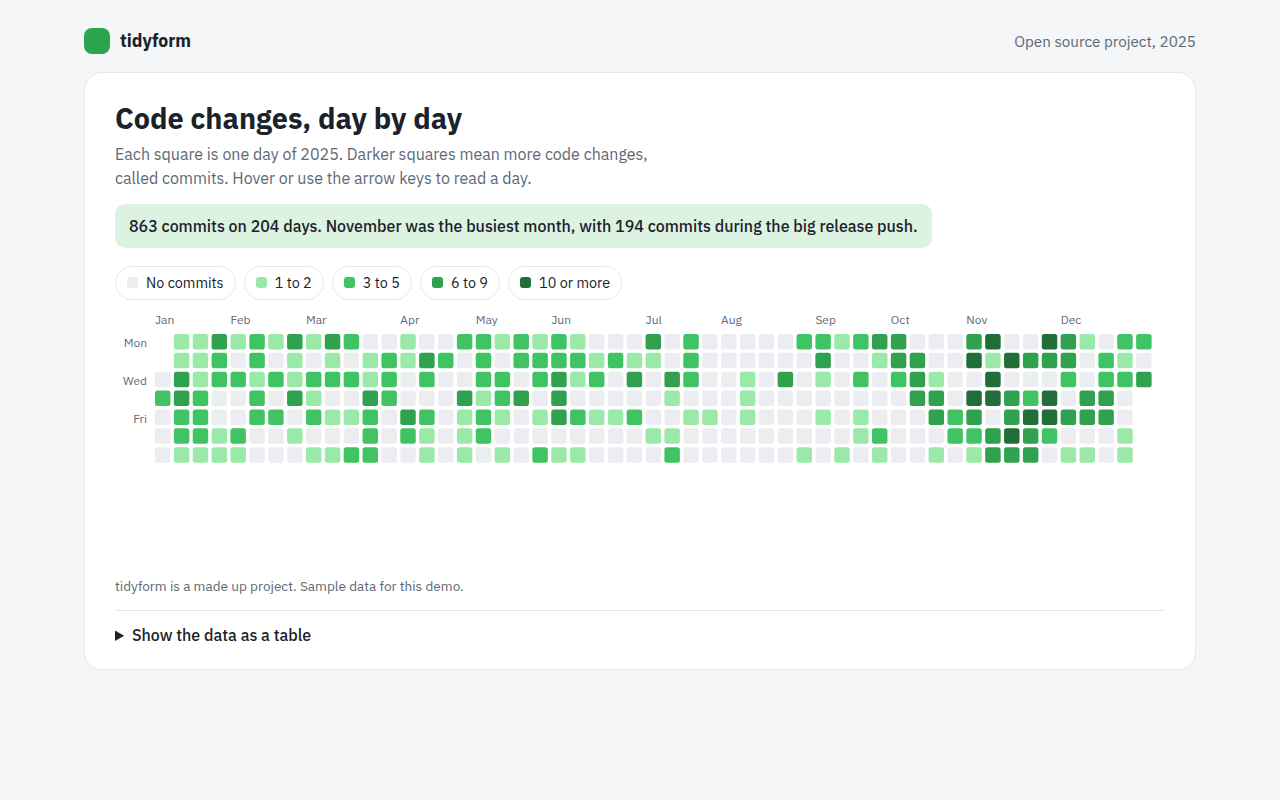
064. Calendar Heatmap
Example: a year of code changes on an open source project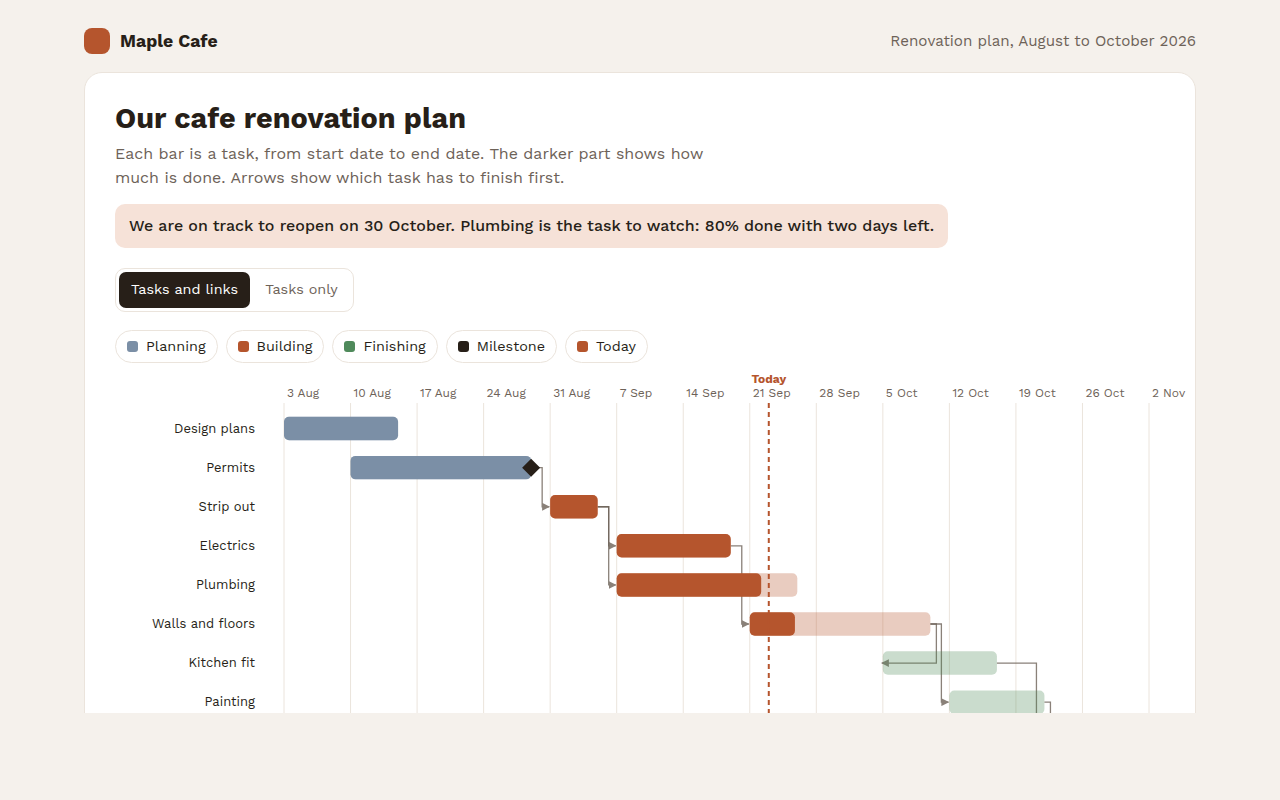
065. Gantt Chart
Example: a cafe renovation plan with tasks and milestones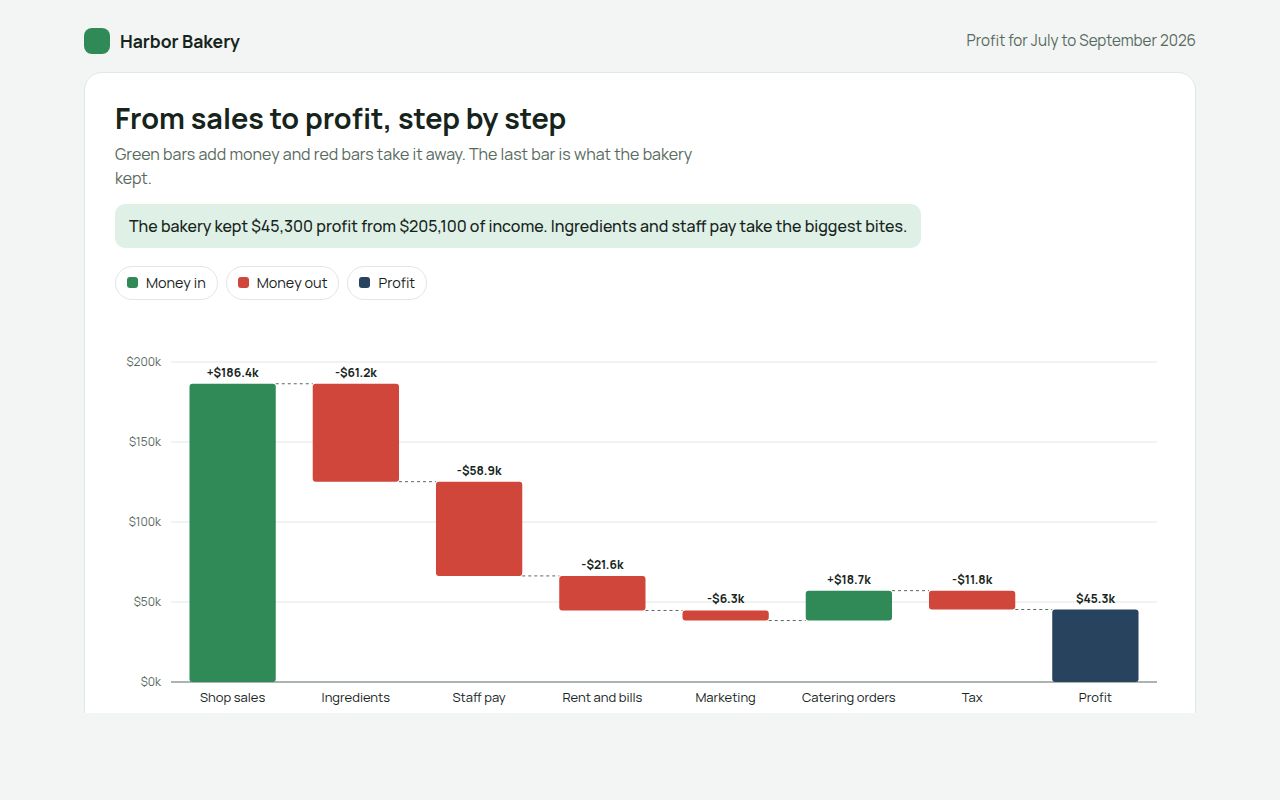
066. Waterfall Chart
Example: how a bakery turns sales into profit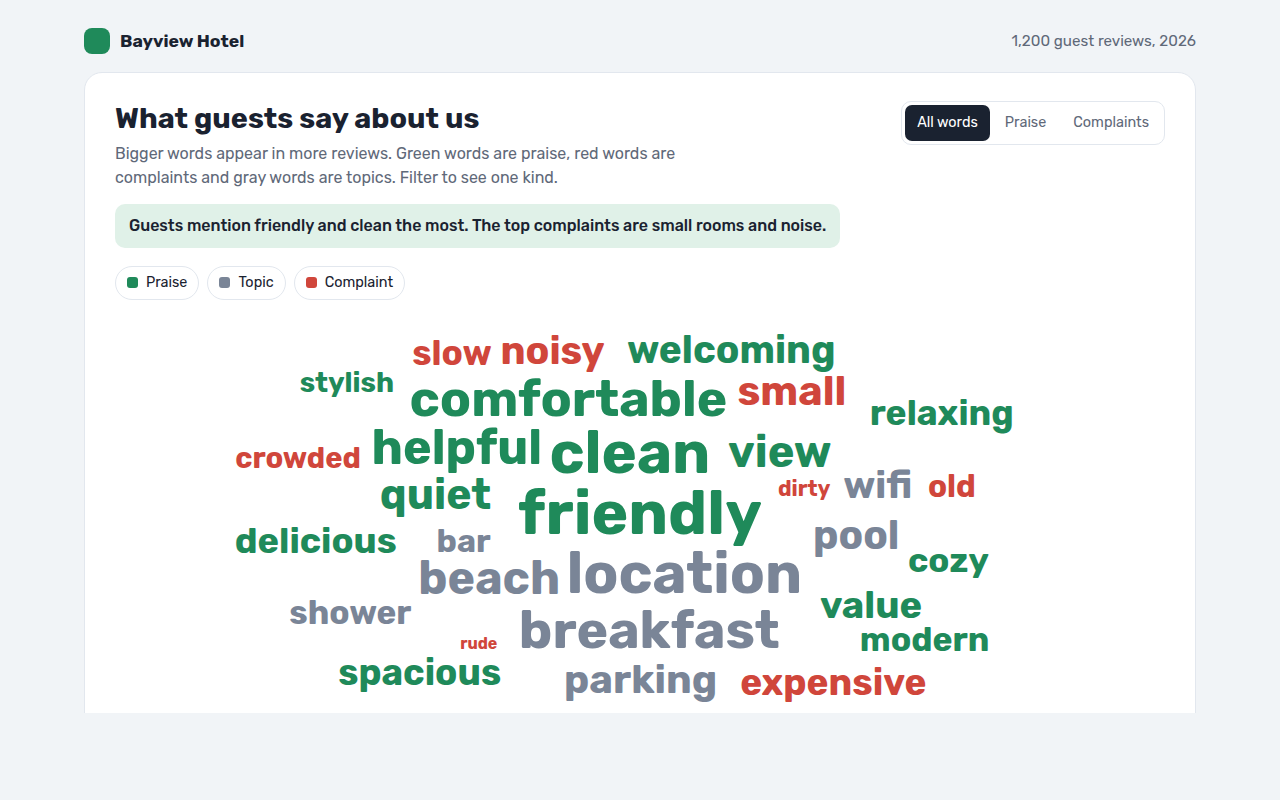
067. Word Cloud
Example: words guests use in hotel reviews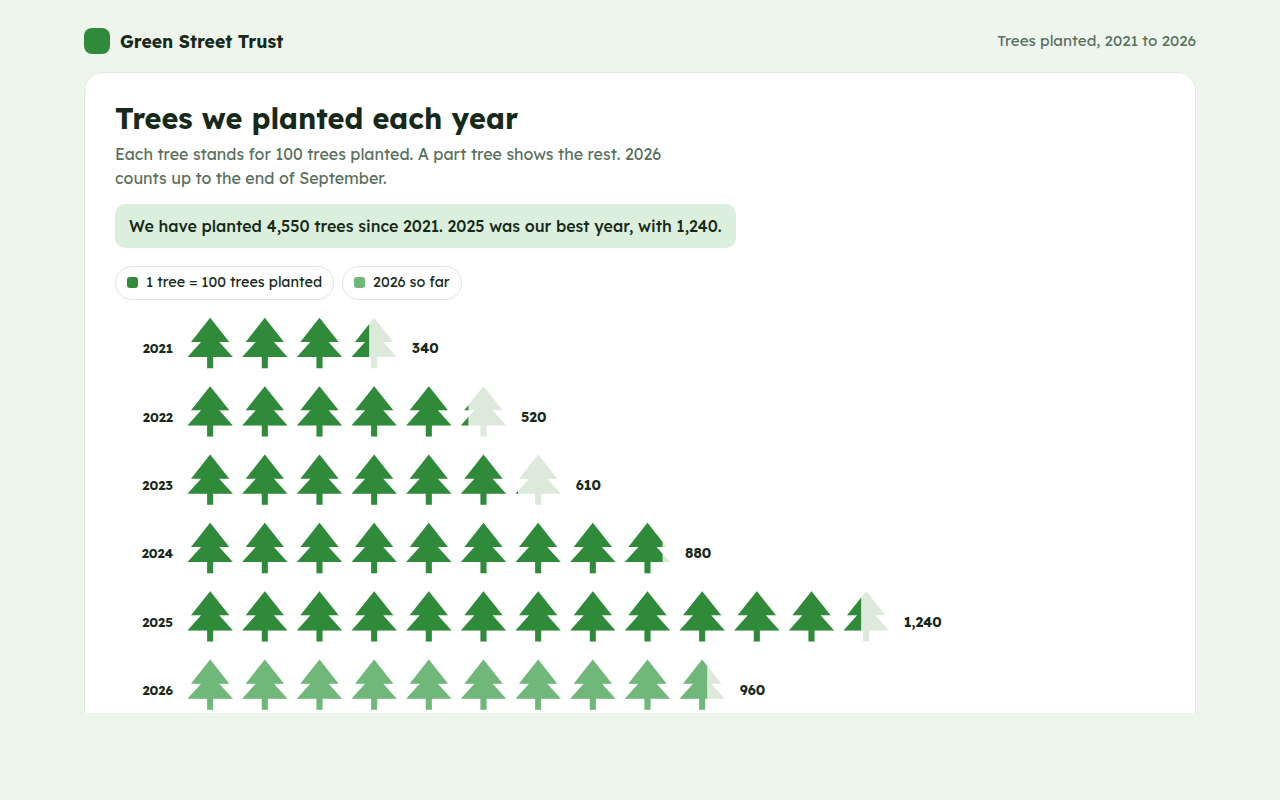
068. Pictogram Chart
Example: trees planted by a charity each year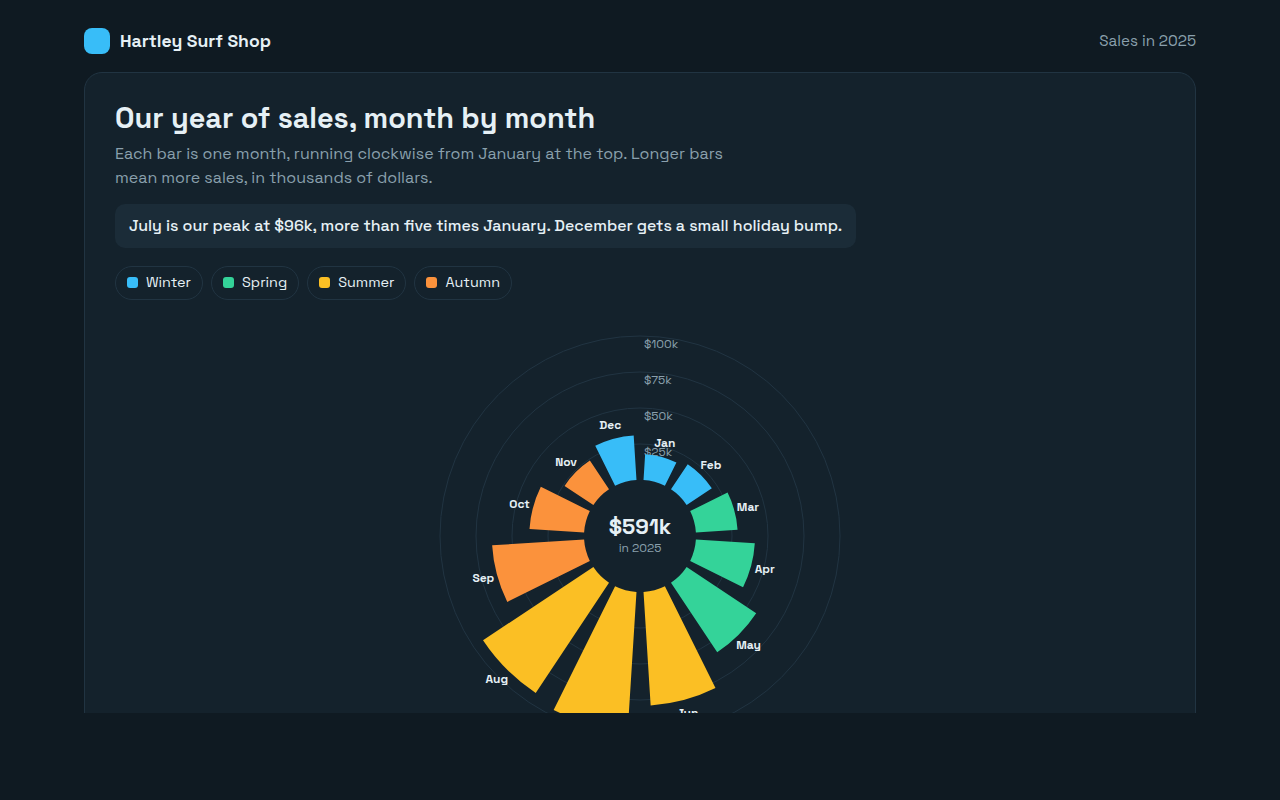
069. Radial Bar Chart
Example: monthly sales for a surf shop